Did You Know?
Your Marginal Effective Tax Rate Could Be 60-70%

Did you know? Your marginal effective tax rate could be as high as 60-70%?!?
You might be thinking….
What is a “Marginal Effective Tax Rate” anyway, and why is it so high?!?
Well….. let’s start with a term you might be more familiar with, your marginal tax rate (no effective).
You marginal tax rate is how much tax you pay on the next dollar you earn. For high income earners this can be above 53%. For the next $100 they earn, $53 goes to taxes and only $47 goes in their pocket.
Thankfully, with our progressive tax system, low and moderate income earners pay a much lower rate, typically in the 20% to 40% range depending on their income. This means a low or moderate income household will only lose $20 to $40 of the next $100 they earn to income tax.
Your marginal effective tax rate is your marginal tax rate plus the claw back from government programs. These claw backs are based on your net income and work much the same way that income tax does, the more you earn, the more of your government benefits get clawed back.
This is a very important consideration when planning your finances. For some low and moderate income households these government claw backs can exceed 30%. This can push Marginal Effective Tax Rate (METR) over 60%. That means $60 of the next $100 they earn will be lost to taxes and claw backs!!!
For example, a family with two children (my situation) who is earning ~$50,000 per year will lose 32.5% of the next dollar to claw backs and 29.7% to income taxes. Their combined marginal effective tax rate is 62.2%!
A family of four earning $50,000 can easily have a marginal effective tax rate that is higher than a single person earning $220,000+.
Two things greatly affect METRs, marital status and children. These two factors affect government benefits the most so in this post I’ll look at how different family situations can affect your METR and I’ll show you in detail how I calculated the METR for my family, including the income level where each government benefit gets clawed back.

What is a marginal effective tax rate?
Unlike your marginal tax rate, which includes just your income tax rates, your marginal effective tax rate considers government benefit programs as well.
Many of these programs are based on net income and ‘claw back’ a percentage of each additional dollar earned. This ‘claw back’ effect is essentially the same as income tax but it works in a slightly different way.
Your particular METR will depend on your unique family situation. Your marital status and number of children will play a large role in calculating your METR. These two factors have a big effect on which government programs you are eligible for.
Age is another factor. Seniors are eligible for unique benefits like Old Age Security (OAS), Guaranteed Income Supplement (GIS) and Property Tax Grants.
To see what benefits you are eligible for now, or might be eligible for in the future, check our previous post about the common income tested government benefits in Canada and in Ontario.
Who does METR impact most?
Marginal effective tax rates impact low and moderate income households the most. This is because government benefits disappear entirely at higher incomes. They also impact families with children. The Canada Child Benefit is one of the most generous government benefits and can continue to claw back well into the $100,000-$200,000+ range.
Single people with moderate income are least impacted by METRs.
Below we’ve provided examples of different METRs for various household types.
There are two graphs. In the first graph we assume the household has only one adult. In the second graph we assume the household has two adults who are married. For married households we also assume income is split evenly between the two adults.
Single Households
[weblator_chart id=”17″]
Single Households
[weblator_chart id=”20″]
Notice how much the Marginal Effective Tax Rate (METR) increases for low income households! Even with no children the household earning $40,000 per year has an extra 7% added to their income tax rate due to government claw backs. These claw backs increase to 38% with three children. A single adult, earning a net income of $40,000 per year, with three children, has a marginal effective tax rate of 58%!
At higher incomes this effect is less pronounced. A single adult earning $80,000 per year has already lost a number of government benefits so their claw back rate is much lower at this income level. Their METR is actually lower than the family who earns half as much.
Married Households
(Income split evenly between adults)
[weblator_chart id=”18″]
Married Households
(Income split evenly between adults)
[weblator_chart id=”21″]
For households with two adults we see a similar effect. The lower income household has a much higher METR. Because we assumed that income is split evenly between the two adults the income tax rate is the same for the $40,000 and $80,000 households. Even though the income tax rate is the same, the METR is much higher for lower income households due to the claw back on government benefits. Even without children this claw back adds an extra 11% on top of the normal income tax rate. With three children this claw back adds 38% for a full marginal effective tax rate of 58%!
Free Resources


Why is METR important?
Marginal effective tax rates are important because this is what the government takes from your next $1 of income.
From a cash flow perspective it’s important to know how much of your next $1 earned you’ll actually receive in your pocket. For some families they may only get $0.42. When they earn an extra $1 they’ll lose a portion to income tax and they’ll lose a portion to government claw backs.
A married couple earning $40,000 per year with three children will lose 58.05% of the next dollar to taxes and government claw backs. Income taxes will take 20% immediately and government claw backs will take another 38% over the next year.
These two effects don’t happen at the same time. Income taxes have an immediate impact but claw backs usually take effect the following July. For a while it will seem like they have more money to spend, but then the following July their government benefits will be reduced. If that extra income is already spent then this delayed claw back can really impact cash flow.
On the flip side a high METR provides a very strong incentive to save money for retirement. RRSP contributions are a tax deduction. RRSP contributions will lower your net income and increase your income tested government benefits. A low income family who is able to put $1,000 into RRSPs would get $580.50 back in the form of income tax refund and higher government benefits. For lower and moderate income households this can provide a very strong incentive to save.
“Your marginal effective tax rate includes benefit claw backs and can easily reach 60-70%”
How do you calculate your METR?
Calculating your METR is easy in theory. You take your income tax rate and add the government claw back rates. In reality however this information is difficult to find.
For the most common federal and Ontario benefit programs we’ve summarized the various claw back rates. For other provinces you can usually find this information on your provincial government’s website.
To determine your METR you need to start with your income tax rate and then add any claw back rates that would affect you at your income level.
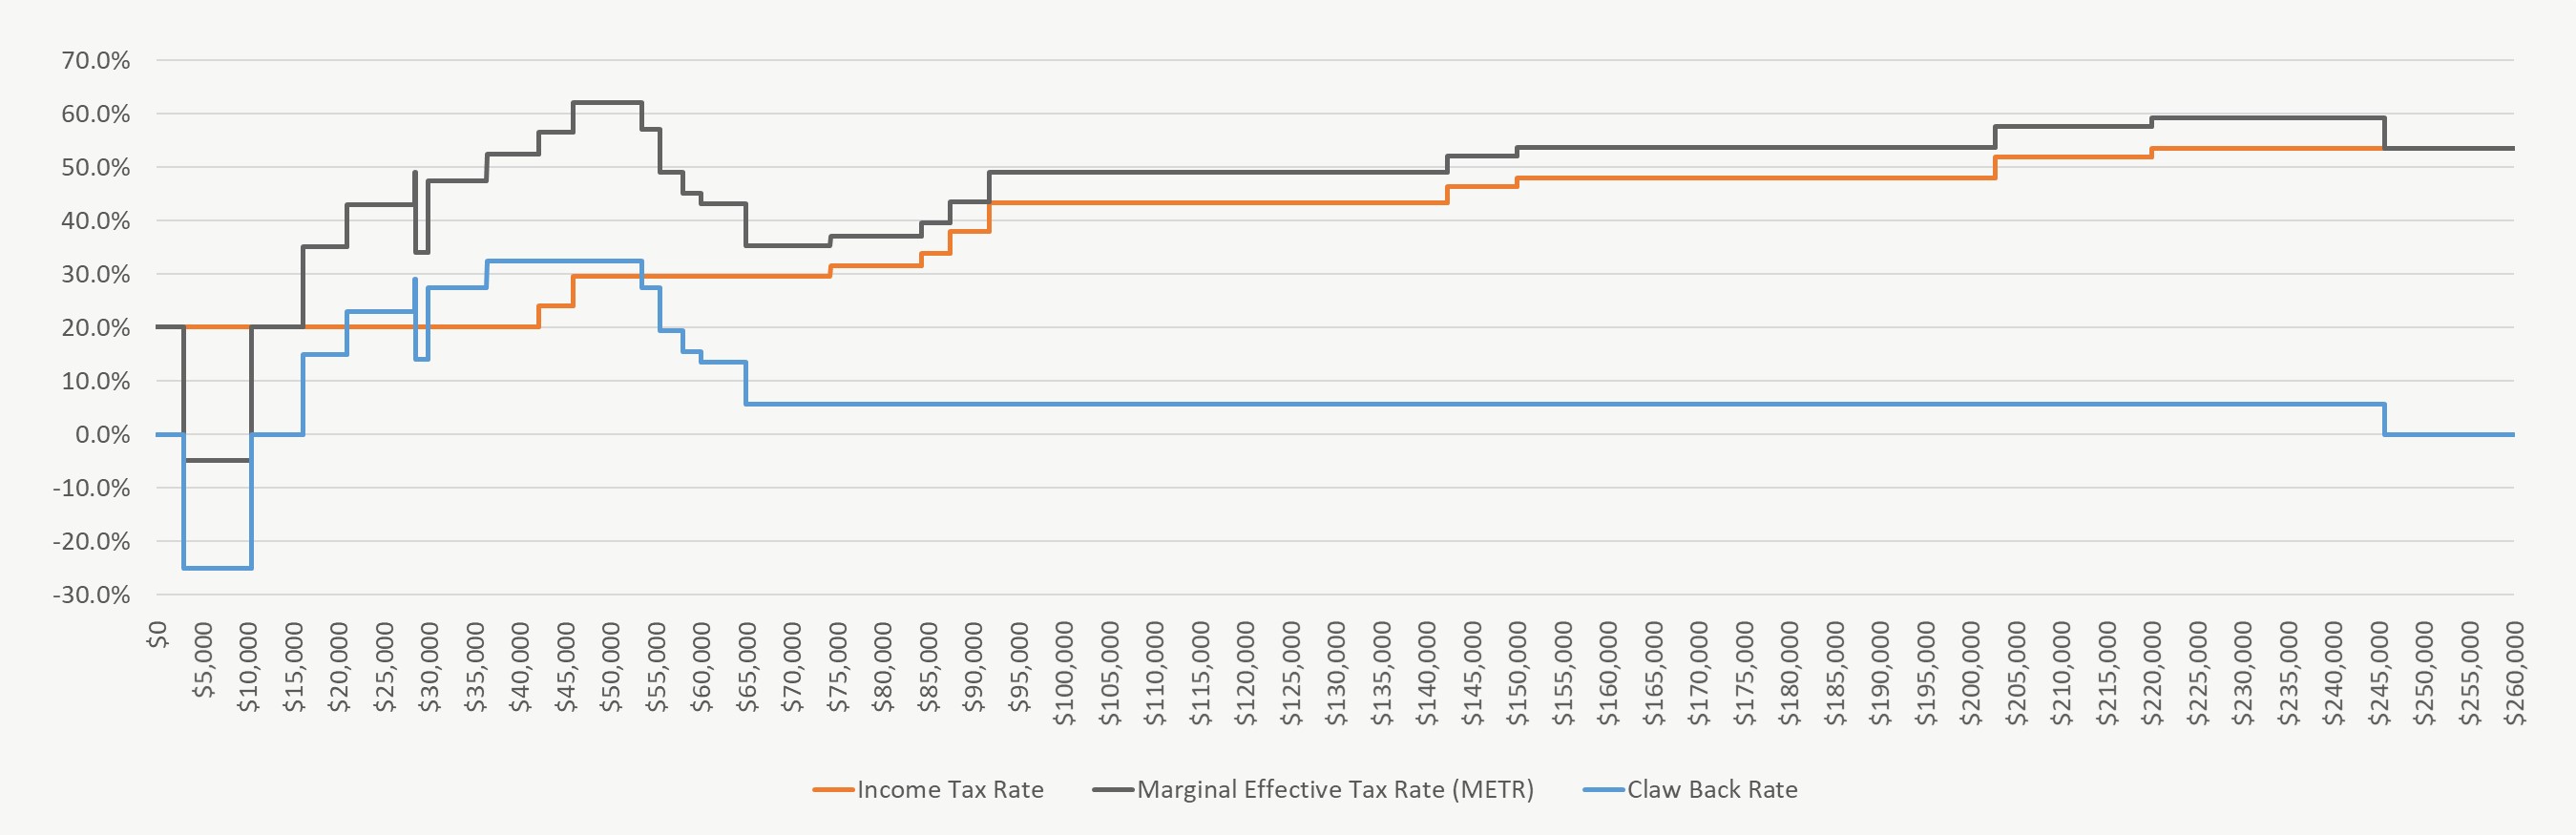
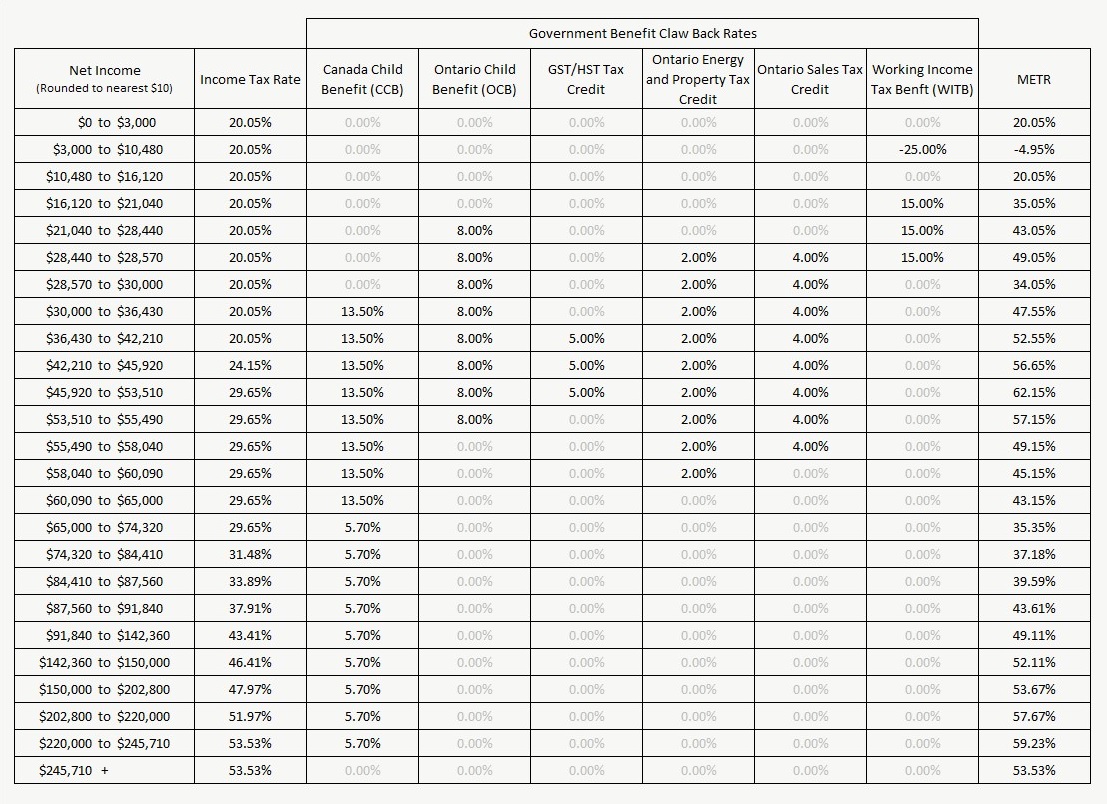
As an example we’ll work through how to do this for a family with two adults and two children (my situation). This family has a sole income earner with a net income of $50,000 per year.
To start, we find the income tax rate for a sole income earner with a net income of $50,000 per year. At this income level 29.65% is the combined Federal and Ontario tax rate. For an extra $100 of net income 29.65% will be lost to income taxes.
On top of the income tax rate we’ll add the benefit claw back rates.
With two children and at this income level there is a 13.5% claw back rate on the Canada Child Benefit and an 8% claw back rate on the Ontario Child Benefit. Combined the claw back rate is 21.5% on child benefits. For an extra $100 in net income 21.5% will be lost to reduced child benefits.
In addition, at this income level this family still qualifies for the federal GST/HST Tax Credit. The claw back rate on this benefit is 5% of every additional dollar earned.
Lastly we add two Ontario provincial benefits. These are part of the Trillium benefit. There is the Ontario Energy and Property Tax Credit with a 2% claw back rate and the Ontario Sales Tax Credit with a 4% claw back rate for a total claw back rate of 6%.
At this income level the Working Income Tax Benefit no longer applies.
(For more detail on the calculation and the rates please see the table below)
In total the marginal effective tax rate is the income rate plus the claw back rates. For our family of two adults and two children this is 29.65% + 21.5% + 5% + 6% for a total of 62.15%.
For an additional $100 earned this family will lose $62.15 to both income tax and reduced government benefits.
The opposite is also true. For a $100 RRSP contribution this family would receive $62.15 back in the form of an income tax rebate and increased government benefits.
This provides a very strong incentive for this family to save money in an RRSP.
Marginal Effective Tax Rate (METR) For A Households With Two Adults and Two Children
(Assumes one adult is sole income earner)
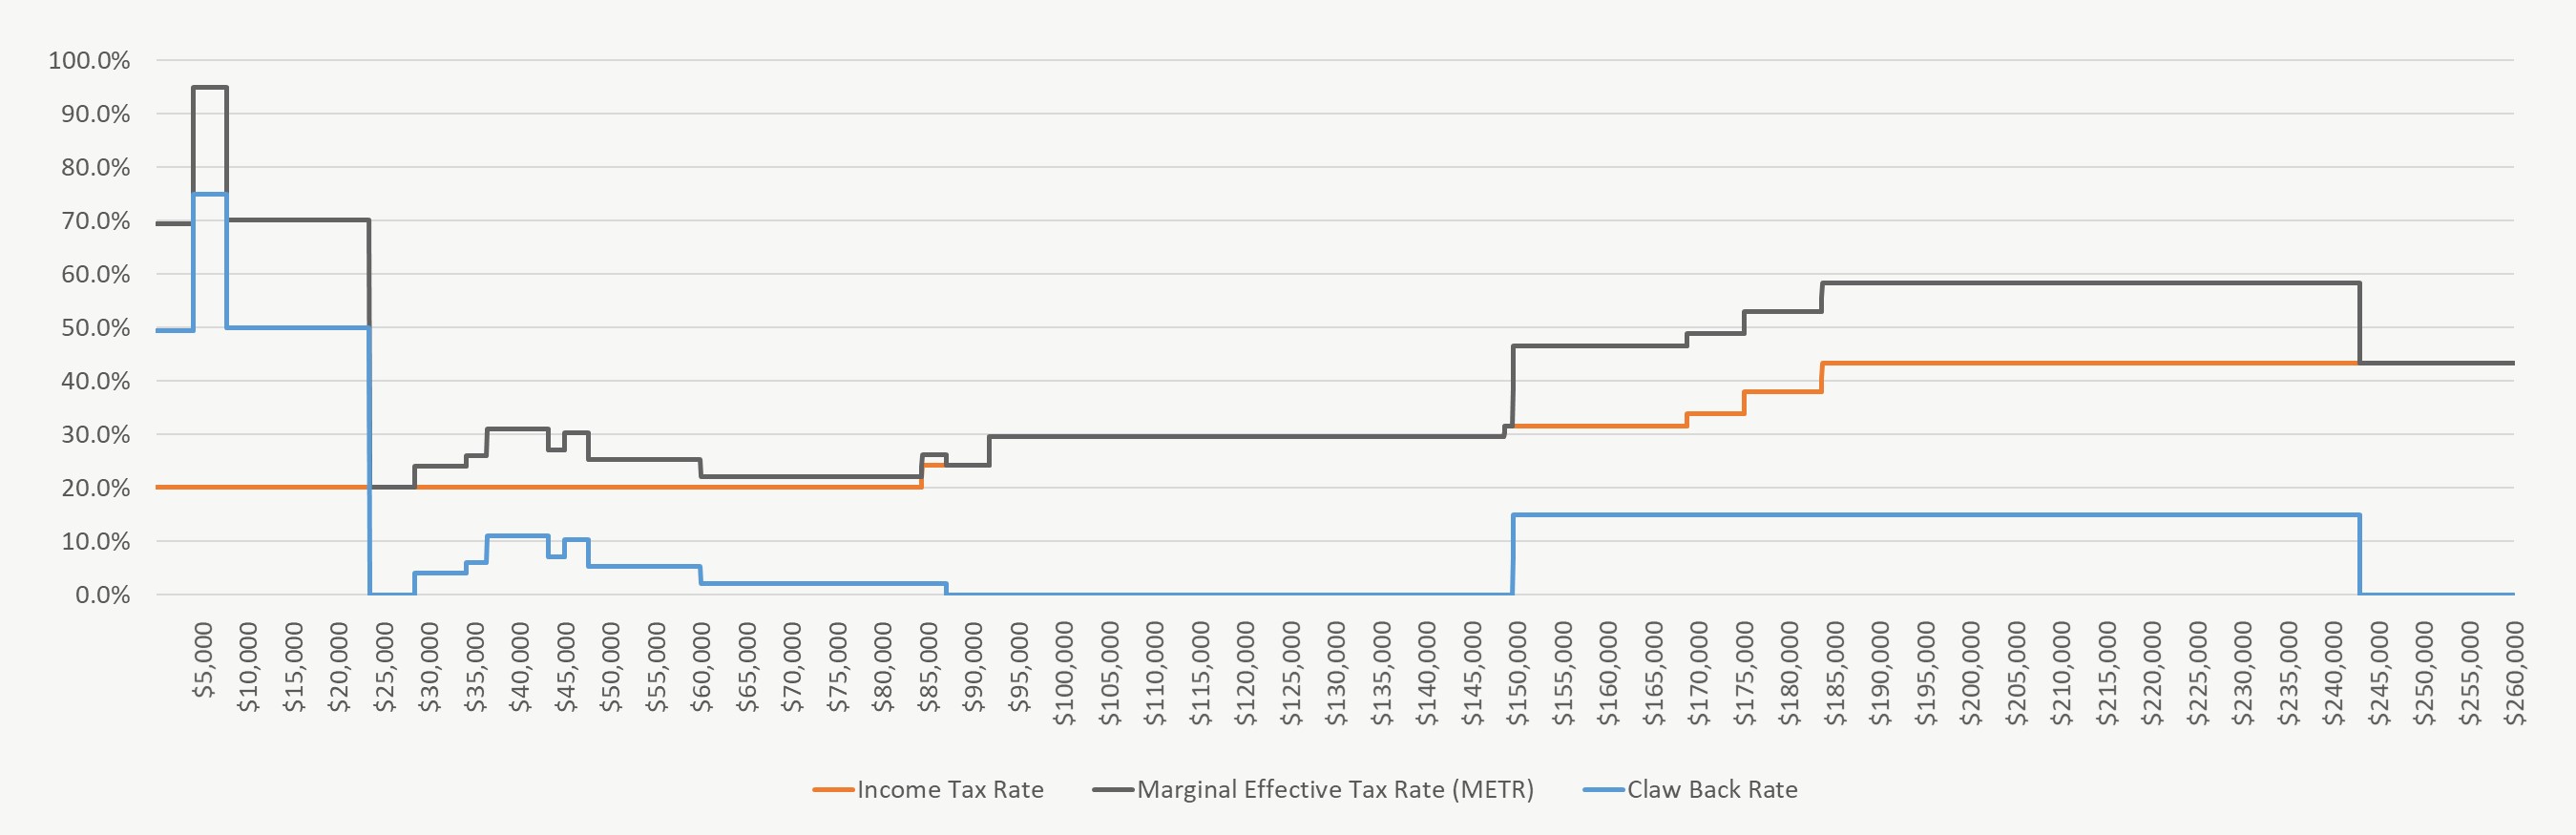
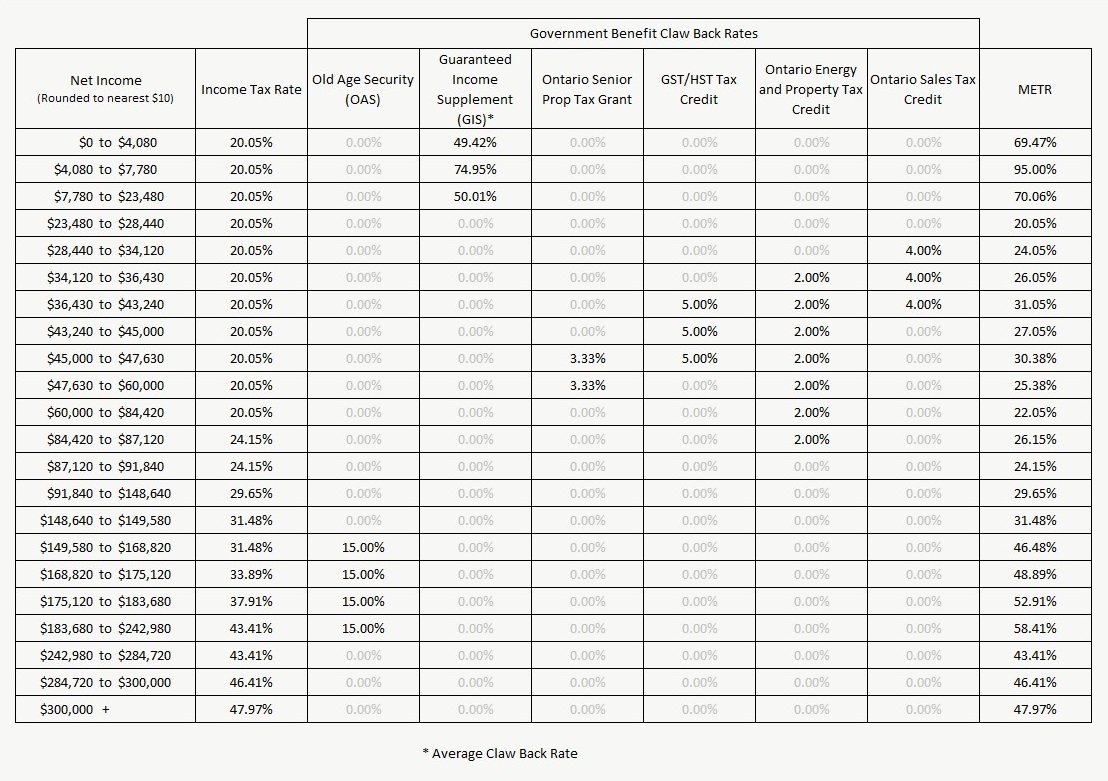
Although there is a strong incentive to save money in an RRSP the analysis wouldn’t be complete without looking at the potential marginal effective tax rate in retirement. Withdrawals from an RRSP in retirement are considered ordinary income and will be taxed at your marginal tax rate. RRSP withdrawals will also impact government retirement benefits like Old Age Security (OAS) and Guaranteed Income Supplement (GIS).
The claw back rates on GIS are especially high. If there is a chance that our family may be eligible for GIS we would want to reconsider those RRSP contributions if the marginal effective tax rate on withdrawal was higher than when contributions were made. (If this was the case then TFSA contributions would be the first choice).
Because our family is targeting a retirement income of $50,000 their METR would be in the 25.38% range. This is based on an income tax rate of 20.05% plus claw backs on the Ontario Property Tax Grant at 3.33% and the Ontario Energy and Property Tax Credit at 2%.
By contributing to the RRSP this family could save $37 of tax & benefits on every $100 of contributions.
(For more detail on the calculation and the rates please see the table below)
Marginal Effective Tax Rate (METR) For Two Adults In Retirement
(Assumes income is split evenly between adults)
Marginal Effective Tax Rate:
Marginal effective tax rates are an important consideration when building a financial plan. Any good financial plan will aim to minimize taxes and maximize government benefits. This tax efficiency will result in a higher net worth and/or increased cash flow. This makes it easier for you to achieve your financial goals with the same level of income.
Your marginal effective tax rate can have a big impact, especially on low and moderate income earners. At these income levels METRs can reach the 50%+ range. This is the same tax level as someone earning $220,000+ per year.
By utilizing tax shelters like RRSPs and TFSAs at the right time you can minimize your overall tax footprint and increase your net worth all while earning the same income.
Note: The Marginal Effective Tax Rates above are for illustrative purposes only. These rates can change and may not apply to your particular situation. Before making any financial decision based on METRs please consult your financial planner.
Join over 250,000 people reading PlanEasy.ca each year. New blog posts weekly!
Tax planning, benefit optimization, budgeting, family planning, retirement planning and more...
Join over 250,000 people reading PlanEasy.ca each year. New blog posts weekly!
Tax planning, benefit optimization, budgeting, family planning, retirement planning and more...


This is why 401ks, HSAs, and any other tax-advantaged accounts are important to take advantage of in the US. Unfortunately many are paying off debt so it makes it difficult to max out retirement accounts/tax-advantaged accounts.
Absolutely! Sheltering money in a tax advantaged account (especially if it’s pre-tax) is a great way to manage your tax liability over the long term.
are you sure the OAS claw back occurs in the $149,580 to $242,980 range of income as shown in your table and as represented in the graph for 2 adults in retirement? I thought it occurred in the $74,789 to +-$121,000 range.
Hi! OAS claw backs are based on individual net income (unlike most government benefits which have claw backs based on family/household net income). So for a couple who can split their income 50/50, the OAS claw back for their total household starts at 2x the individual claw back.
Hi Owen! Love your blog. What a valuable resource. In the retirement scenario, would it make sense to include the age amount tax credit in the METR calculation?
Hi Paul, excellent question, you are absolutely right! The Age Credit itself can be included AND the reduction in the Age Credit as income increases. The reduction in the Age Credit effectively adds 2.25%-3.01% to the marginal effective tax rate.
Here is another blog post with some details on the Age Credit and how it gets reduced…
https://www.planeasy.ca/how-the-age-amount-tax-credit-can-increase-your-marginal-tax-rate-in-retirement/
Owen, this is an excellent article!
Thanks for putting this together as it is something that does not come across my radar all that often.
Steve B., CFP®
Hi Steve, thank you! And thanks for the comment!
Thanks so much for this resource. I’m wondering if you would ever consider offering a calculator with different input options (age, income, # of kids) to calculate METR for different situations. The Canada Child benefit calculator does a decent job of compiling benefits, and if you try it out for a few different income amounts it can give a good picture of clawback amounts, but it’s a little cumbersome.
There aren’t enough people talking about clawback rates, and I think a calculator would be really helpful in raising awareness and literacy on this topic.
Hi Jamie, thanks for your comment! Our financial planning platform will do all these benefit calculations for you and automatically includes these benefits in your financial plan. The platform will also create “tax and benefit curves” to help visualize at what income levels the benefit clawback rates jump dramatically. The platform creates all the METR calculations for your unique situation (age, # of children, rent/own etc etc) This can be helpful when planning RRSP and TFSA contributions. Check out this case study that shows the tax and benefit curves…
https://www.planeasy.ca/case-study-low-income-retirement-plan/