Retirement Calculator Assumptions:
The Good, The Bad, And The Ugly

Retirement calculators are everywhere. Nearly every financial institution has some form of retirement calculator. They all work very similarly, they require a few inputs perhaps age, income, spending etc. and then they provide some analysis/recommendation about retirement, how much to save, how much to spend etc.
But how accurate are these retirement calculators? What assumptions are they making when doing a retirement projection? Are they even worth the effort?
In this post we’re looking at some of the good, the bad, and the ugly parts of retirement calculators.
In general, retirement calculators make some very broad assumptions to create a very simple retirement projection very quickly. There is nothing simple about retirement, so creating a projection with only a few inputs in only a few seconds is already somewhat suspect, but as we’ll see below, the possible issues go way beyond that.
These are just some of the issues to watch out for when using a retirement calculator.
Unrealistic Future Income (Too High or Too Low)
Income is an important factor in any financial plan. Without income we can’t achieve spending goals, save for infrequent expenses, save for retirement etc. etc. Assumptions around income are therefore very important. A bit more income or a bit less income can have a dramatic effect over time.
But many retirement calculators make some very broad assumptions around income, some good, some bad, and some just ugly.
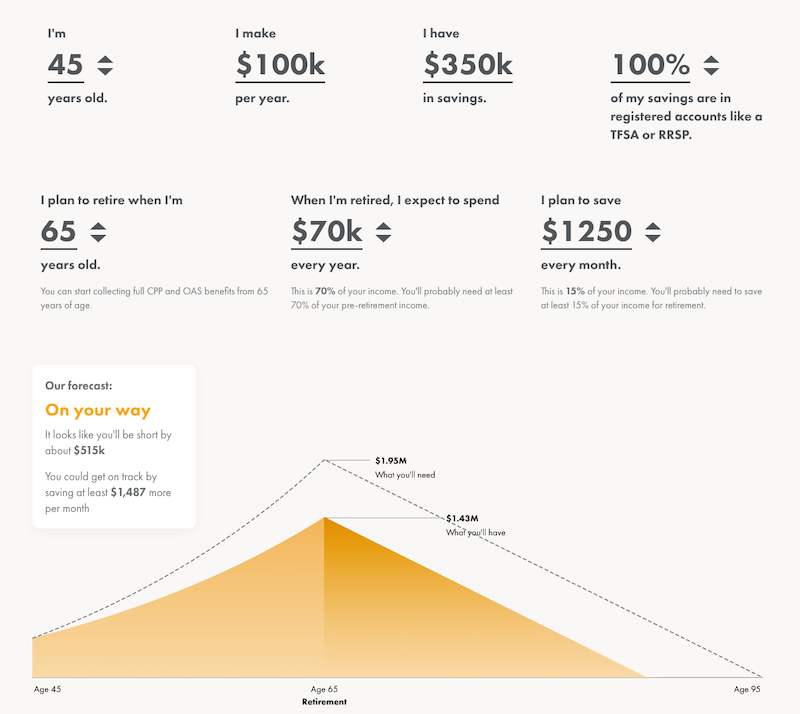
This is an example of an ugly income assumption. One that makes the plan look much worse than it is. What’s surprising is that this retirement calculator is from a well-known robo-advisor (although it appears that it has not been updated since 2018).
Their assumption is essentially that there is NO income growth after age 45, not even increases with inflation. The inflation assumption is +2%, but the income assumption is +2% until age 45 and then nothing after. Basically, the calculator assumes you lose buying power steadily over 20-years between age 45 and retirement at age 65. Ouch.
That one basic assumption means that $100,000 of income in today’s dollars turns into the equivalent of $67,297 of income over 20-years as the price of goods and services increase but income does not. That’s not just a bad assumption, that’s an ugly assumption.
Naturally the calculator makes some dramatic recommendations as a result of this assumption and some other not so great assumptions (like adding a partner doesn’t change tax/CPP/OAS).
For example, with the inputs below, their recommendation is to save 33% of gross income from age 45 until retirement at age 65. Yikes.
Generic Future Spending Rules
Another ugly retirement calculator assumption is around spending. The typical assumption used for retirement spending is 70% of current income. The ugly part about this assumption is that spending is so important to a retirement plan that it deserves way more attention than some simple “rule”.
This assumption is ugly because spending varies greatly from person to person, even when they have the same pre-retirement income.
For example, imagine a family earning $100,000 per year with two good defined benefit pensions, they might not be saving much each year and may spend nearly all their income. Compare that with another family with the same $100,000 income per year but who are saving 20% per year in RRSPs and TFSAs for their retirement, it’s likely that this second family is spending much less than the first family and therefore needs much less in retirement. Same income, but very different household spending.
The impact of spending is huge too. A bit of extra retirement spending, spread over 30-40 years, plus the associated income tax payments on withdrawal, can easily mean the difference between a stress-free retirement and running out of money.
If you’re going to use a retirement calculator, don’t just use the default spending assumption. Take some time to work out your ideal retirement spending. Look at what you’re spending today and how that might change in retirement. Don’t forget to add more money for travel, hobbies, entertainment etc. and don’t forget to plan for infrequent expenses like home repairs, vehicle upgrades and vehicle repairs.
Unrealistic Rates Of Return
One of the easiest ways to make a retirement plan “look better” is by including an unrealistic rate of investment return. What is an unrealistic rate of return? Basically, any return that is higher than FP Canada guidelines (the national body that oversees the Certified Financial Planner (CFP) and Qualified Associate Financial Planner (QAFP) designations).
For 2020, the projection guidelines suggest the following rates of return are reasonable for financial planners to use in their projections (with an extra 0.5% if doing Monte Carlo type success rate analysis)…
- Fixed Income: 2.9%
- Canadian Equities: 6.1%
- Foreign Developed-Market Equities: 6.4%
- Foreign Emerging-Market Equities: 7.1%
Compare those FP Canada guidelines with these rate of return assumptions from an online retirement planning tool…
- Moderate: 40/60 Equity/Fixed Income: 5.0%
- Growth: 60/40 Equity/Fixed Income: 6.0%
- Aggressive: 70/30 Equity/Fixed Income: 7.0%
The rate of return assumptions used by this retirement planning tool are quite a bit above the projection guidelines. The Aggressive portfolio has a rate of return of 7.0% while the projection guidelines would suggest something closer to 5.4%. That 1.6% difference is going to be quite a shock for any retiree who uses this retirement calculator and experiences a lower average rate of return in the future.
Notice anything else odd about the assumptions from this retirement calculator? The assumptions are not linear. The equity allocation when going from a moderate portfolio to a growth portfolio increases by +20% and in turn this increases the rate of return assumption by +1.0%. However, when going from a growth portfolio to an aggressive portfolio the equity allocation only increases by +10% but the rate of return still increases by 1.0%! Odd. Very odd.
It’s important to understand the rate of return assumptions being used by any retirement calculator. Assumptions that are too high are going to provide overly optimistic retirement projections. Assumptions that are too low are going to provide overly pessimistic retirement projections.
In my opinion, the best way to test a retirement plan is by using historical rates of return over multiple periods of time. This will include periods with both above average and below average returns and will give a much truer sense of the different “paths” a retirement plan could take in the future.
Using Averages
The last way retirement calculators can provide some ugly results is by using averages. The most common average used in many retirement calculators is average CPP.
Averages are great in certain situations, and sometimes they’re unavoidable, but using averages in a retirement plan is going to mean that plan is wrong 99.9999% of the time (unless of course that individual is average in every single way!) As a result, averages should be used sparingly and only when the change in accuracy is minor.
Why is average CPP used? Because calculating CPP requires work. It requires access to an individual’s Statement of Contributions; this helps us understand past contributions to CPP. It also requires assumptions about future income; which we saw above is an often overlooked or at least broadly estimated input in a retirement calculator.
Why does this matter? Using average CPP could mean that annual retirement income is underestimated (or overestimated) by thousands per year for individuals or even tens of thousands for couples. Delaying CPP to age 70 can mean a maximum CPP over $20,000 per year for an individual and over $40,000 per year for a couple. Compare that with average CPP which is around $8,500 for an individual and $17,000 for a couple. A big difference!
This is why you take retirement calculators with a “grain of salt”.
Free Resources

Join over 250,000 people reading PlanEasy.ca each year. New blog posts weekly!
Tax planning, benefit optimization, budgeting, family planning, retirement planning and more...
Join over 250,000 people reading PlanEasy.ca each year. New blog posts weekly!
Tax planning, benefit optimization, budgeting, family planning, retirement planning and more...


0 Comments