When The Stock Market Drops, What Is Normal Versus Concerning?

When the stock market drops, what should you consider “normal” and when should you be concerned?
When there is a stock market drop, a large stock market correction, or a recession, it can be very disconcerting to see your portfolio drop day after day and week after week. For new investors, and even many experienced investors, seeing their portfolio decline by $1,000, $10,000, or even $100,000+ can be tough to stomach.
But as investors, we should anticipate that our portfolios will drop and some point. A portfolio will probably go through 5-10 large stock market drops over a lifetime. The question is, how large a drop is considered “normal”? And at what point should you be concerned?
During a large stock market drop it can be hard to avoid negative headlines. Bad news sells and when the stock market drops it can make headlines for months or years. This “headline effect” can cause even more panic.
But large drops in the stock market have been happening for decades. The reason may be different, but the result is always the same, a large decline in portfolio value followed by a recovery (at some point).
These historical stock market drops can teach us a good lesson about what is considered “normal”.
What “normal” is will depend on a few factors. The first factor is your level of diversification. The second factor is your current asset allocation, how is your portfolio allocated between equities and fixed-income. The third factor is if you’re currently in the accumulation phase, which can help mute the impact of a large stock market drop, or if you’re in the decumulation phase, when retirement withdrawals can amplify the impact of a large stock market decline.
Let’s look at some historical data to understand what “normal” looks like based on some of these factors.
Watch The Video!
Factor #1: Diversification
For a poorly diversified portfolio, the chance of the portfolio dropping to zero can be quite high. The smaller the number of individual investments, the higher the chance of very large portfolio decline. When you put all your eggs in one basket, the risk of losing everything increases.
To maintain a minimum level of diversification, individual investments should represent no more than 3%-5% of the portfolio.
If a portfolio contains only a handful of investments, that are all 5%+ or more of the portfolio, then this creates additional risk. This additional risk can lead to some extremely large portfolio declines.
On the other hand, for a globally diversified portfolio, the chance of the portfolio dropping to zero is virtually none.
For a portfolio that is comprised of 100’s or 1000’s of global investments, the only way a portfolio would go to zero is if the entire global economy ceased to exist. If this were to happen, a large portfolio decline is probably the least of our concerns.
The analysis to follow always assumes a low-cost globally diversified investment portfolio with 1,000’s of individual investments.
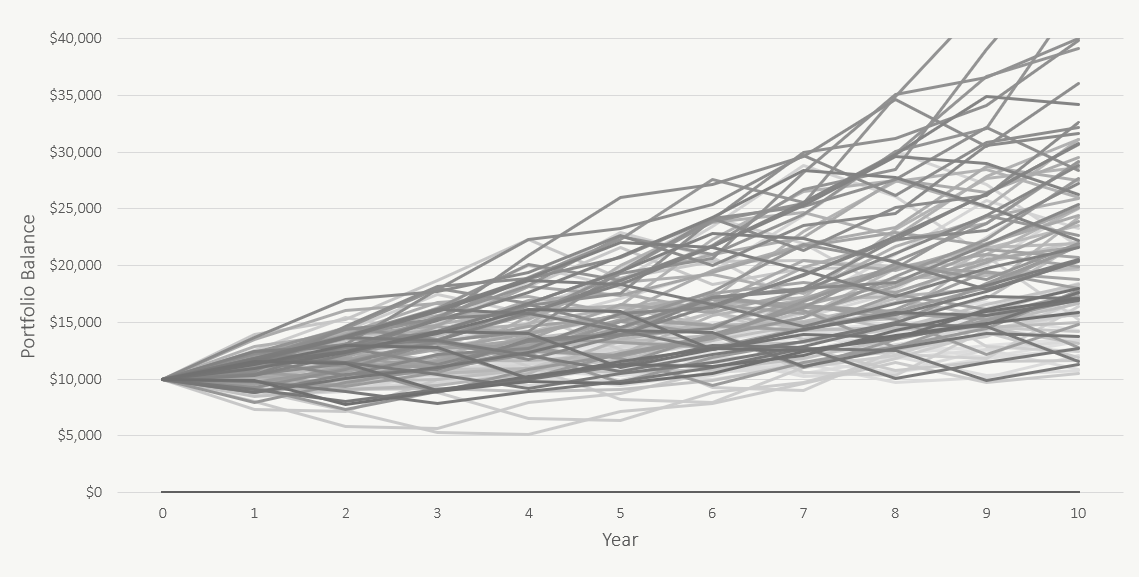
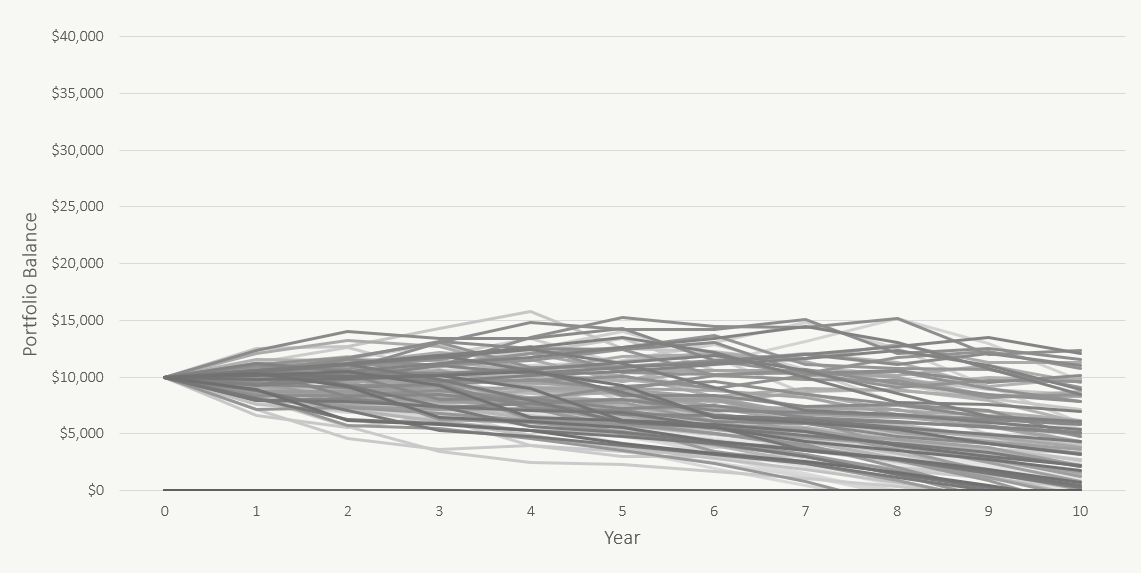
Portfolio Drops For A Globally Diversified Portfolio
(This chart represents all the “paths” that a globally diversified portfolio could take over 10-years based on historical periods of stock return, bond returns, and inflation rates)
Factor #2: Asset Allocation
Another very important factor is the asset allocation of the portfolio. Asset allocation refers to the portfolio’s mix between equities investments and fixed-income investments. The higher the equity allocation, the larger the risk of a decline in value.
Equities have higher risk and will experience larger declines during a stock market correction.
Fixed-income like bonds and GICs on the other hand have less risk and will experience smaller declines during a stock market correction (or sometimes may even go up in value if interest rates decline).
As a general rule, the higher the equity allocation, the larger the potential decline in the portfolio during a stock market correction or a recession.
Let’s look at three examples using a $10,000 portfolio. Let’s look at three portfolios with a 100/0, 80/20, and 60/40 asset allocation between equities/fixed-income. This will give us a sense of what “normal” looks like based on historical results.
Portfolio Drops For A Portfolio With 100/0 Asset Allocation
(This chart represents all the “paths” that a portfolio with 100/0 asset allocation could take over 10-years based on historical periods of stock return, bond returns, and inflation rates)
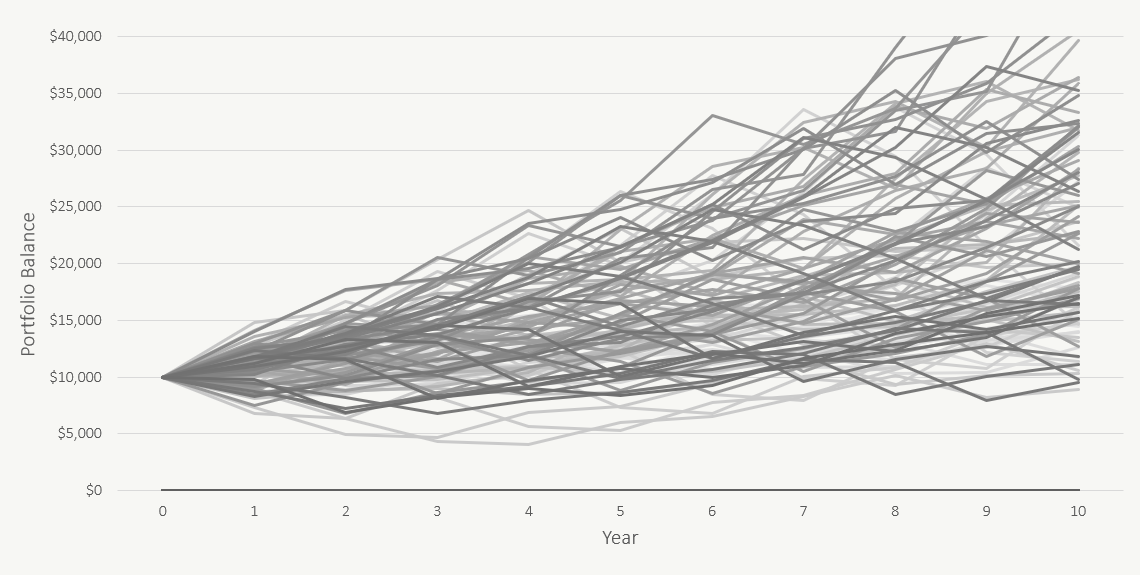
Portfolio Drops For A Portfolio With 80/20 Asset Allocation
(This chart represents all the “paths” that a portfolio with 80/20 asset allocation could take over 10-years based on historical periods of stock return, bond returns, and inflation rates)
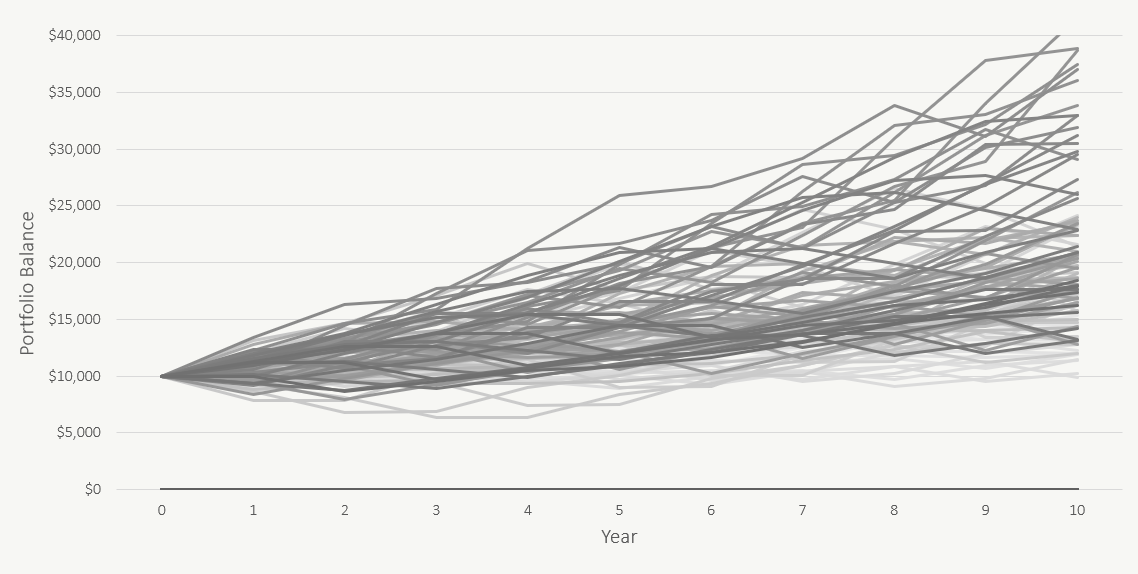
Portfolio Drops For A Portfolio With 60/40 Asset Allocation
(This chart represents all the “paths” that a portfolio with 60/40 asset allocation could take over 10-years based on historical periods of stock return, bond returns, and inflation rates)
As a general rule, an investor should expect that their portfolio will drop by half their equity allocation at some point. This means a portfolio with a 100/0 asset allocation should expect their portfolio to drop by 50% at some point. This means a portfolio with an 80/20 asset allocation should expect their portfolio to drop by 40% at some point. And this means a portfolio with a 60/40 asset allocation should expect their portfolio to drop by 30% at some point. These drops would all be considered “normal” for these asset allocations based on historical results
Of course, using past returns is a good way to test a portfolio but past returns may not fully capture the investment returns we may experience in the future, so these are general rules only.
Factor #3: Accumulation Phase Or Decumulation Phase
Making investment contributions during the accumulation phase, or investment withdrawals during the decumulation phase, will change how much a portfolio drops during a stock market correction or recession.
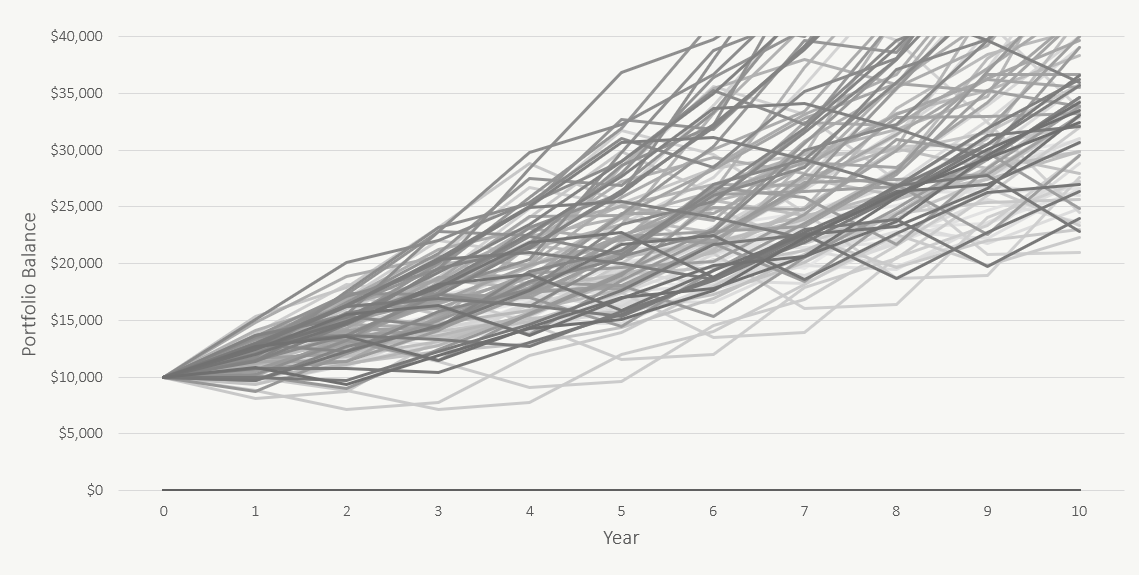
During the accumulation phase, additional investment contributions will mute the impact of a large stock market drop. In fact, during the accumulation phase a large decline in stock market value is actually a good thing as investors can purchase more investment units for the same dollar contribution. Adding more to the investment portfolio during a stock market drop will mean the portfolio declines less.
In this example, a $10,000 portfolio at an 80/20 asset allocation has $1,000 in contributions per year. Notice how the portfolio doesn’t decline as far as in the examples above? This is because contributions help mute the impact of a stock market correction or recession.
But during the decumulation phase however, large declines in an investment portfolio right before retirement, or in early retirement, can be a very large risk to a retirement plan. During the decumulation phase, withdrawals from the portfolio will amplify portfolio declines.
A large portfolio decline right before retirement, or in early retirement, creates a higher risk of running out of money in the future. The risk so large it has its own name, sequence of returns risk (SoRR). This is when an unfortunate sequence of poor investment returns right before retirement, or in early retirement, can dramatically increase the risk of running out of money in the future. Imagine going through the Great Depression just as you’re about to retire. This is sequence of returns risk at the extreme.
This risk is so large that it can sometimes require changes in discretionary spending to decrease the draw on the portfolio while it’s depressed in value. Drawing too much can lead to the portfolio running out of money in the future.
In this example a $10,000 portfolio at an 80/20 asset allocation has $1,000 in withdrawals per year. Notice how the portfolio quickly declines to $0 in some periods of historical investment returns? In this case the portfolio withdrawals of $1,000 per year were much too high to be sustainable.
Because of how important this risk is in retirement, and how much it depends on specific factors within the plan, it’s important for those approaching retirement to “stress test” their retirement plan to ensure they will not run out of money during periods of very poor investment returns or high inflation rates.
Stress Testing A Retirement Plan With Historical Stock Market Drops
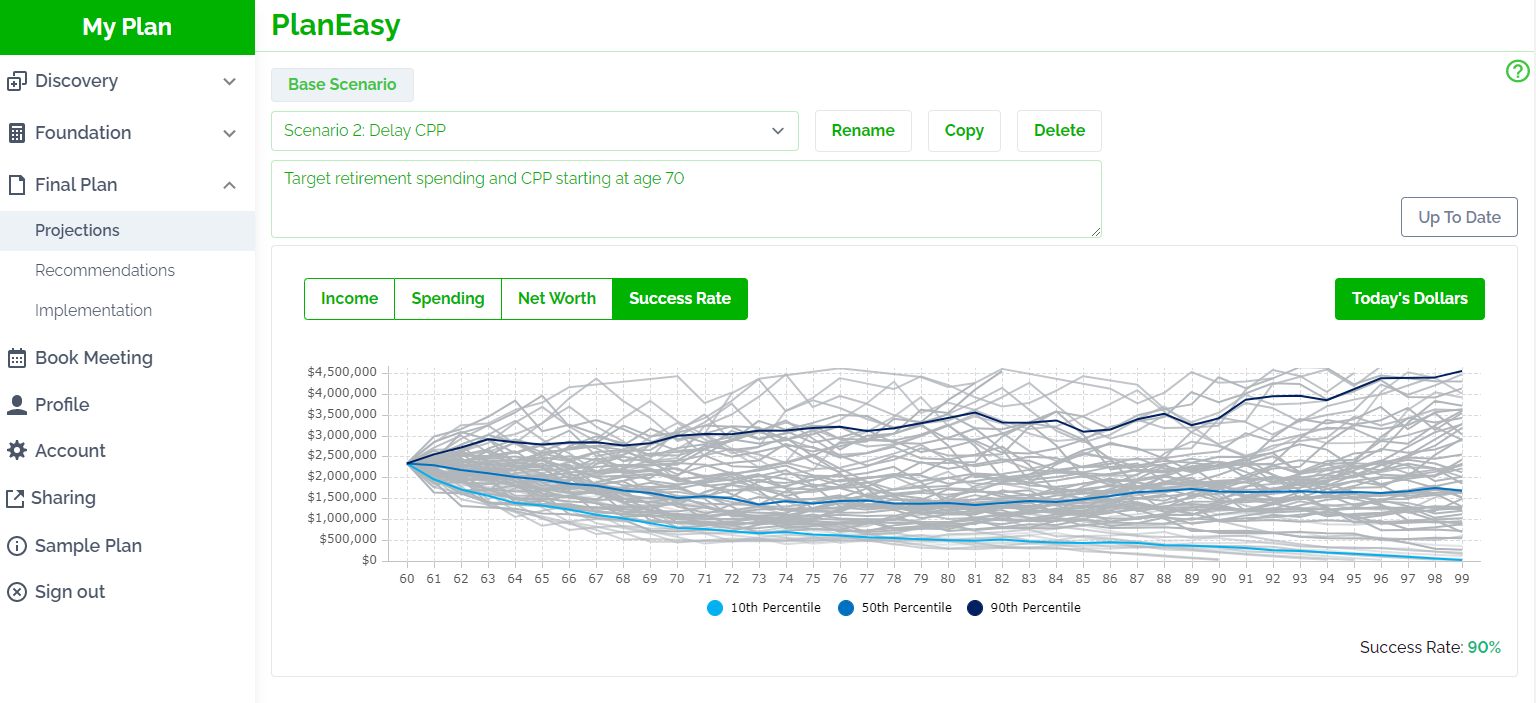
If you’re using the PlanEasy platform to create your retirement plan, and if you’re working with one of our advice-only financial planners, then one area to focus on is your success rate in retirement.
The success rate analysis is located in the Final Plan > Projections section. This success rate analysis gives us an idea of how the retirement portfolio could perform in the future based on the plans specific circumstances like portfolio balance, portfolio asset allocation, pension income, CPP and OAS start date etc. etc.
Using historical periods of stock returns, bond returns, and inflation rates, we map out the different “paths” that the portfolio could take in retirement. Each line represents one period of historical results. The lower lines represent challenging periods like the Great Depression or periods of high inflation like the 1970’s.
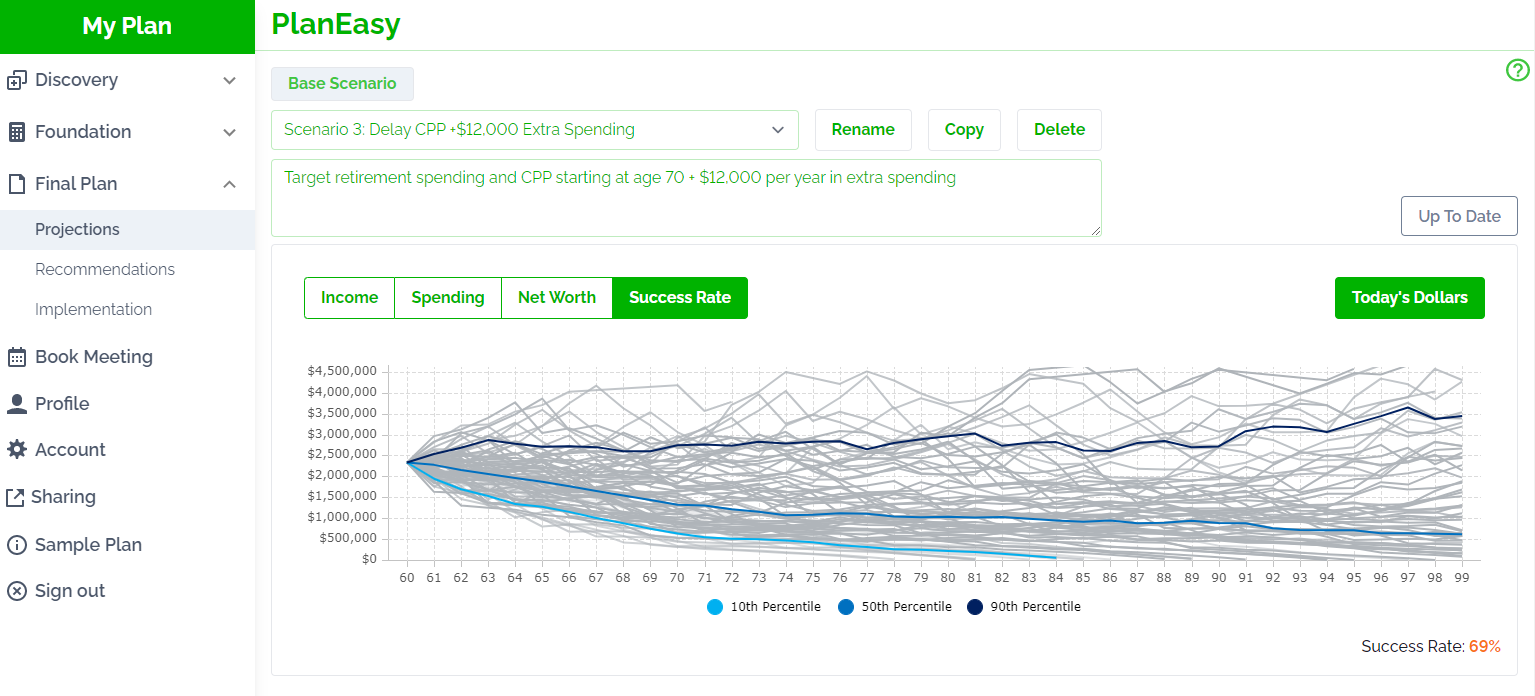
A success rate of 80% or higher is considered acceptable, especially when there is a reasonable amount of discretionary spending within the plan.
A success rate of 60% to 80% is a concern and would require substantial changes to spending if investment returns or inflation rates were worse than expected in early retirement.
A success rate below 60% is a red flag. This means that 40% or more of historical periods would cause the retirement portfolio to run out of money in the future if they happened again. We never know what will happen in the future but a success rate below 60% is a very large concern.
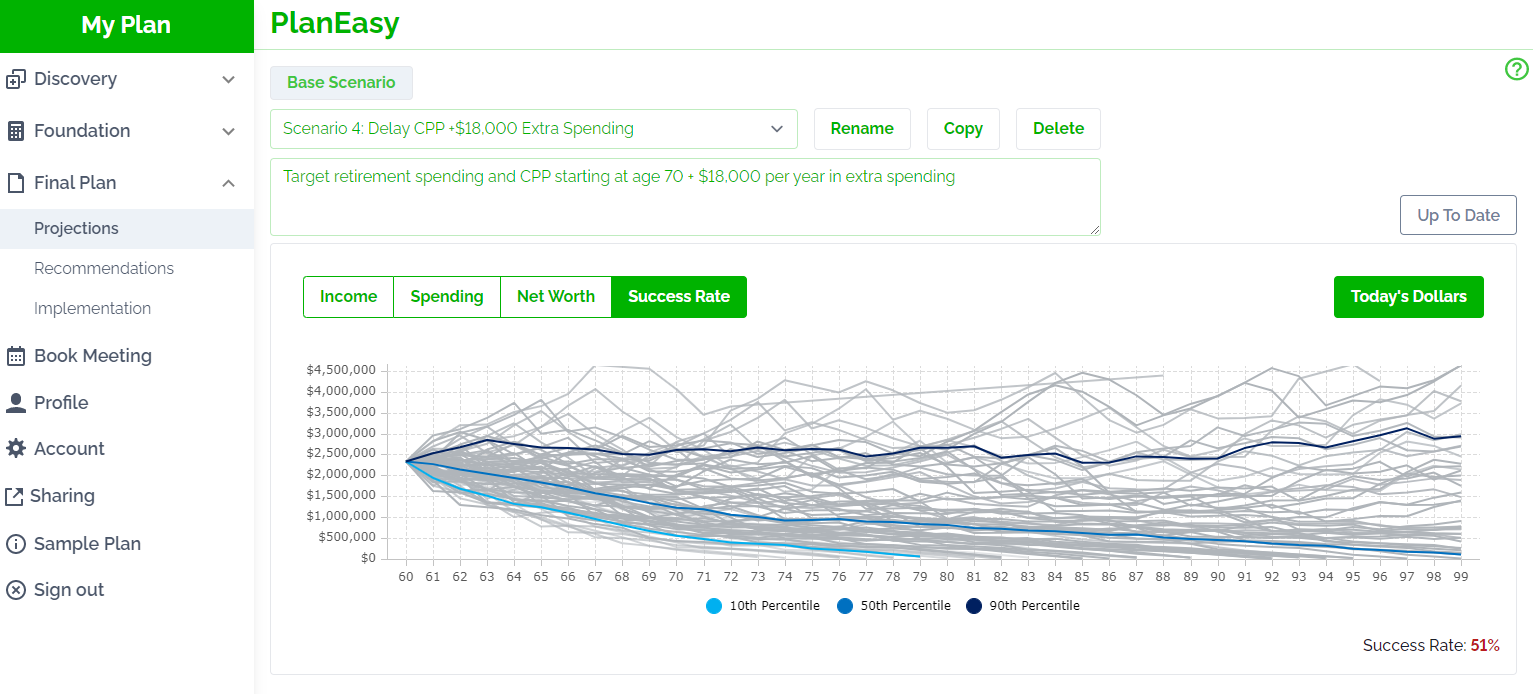
Stress testing a retirement plan is important. Even a small change in spending can make a large impact on the success rate of a retirement plan. Create your own retirement plan using the PlanEasy platform. Click “Start Planning” to see if we’re a good fit.
Join over 250,000 people reading PlanEasy.ca each year. New blog posts weekly!
Tax planning, benefit optimization, budgeting, family planning, retirement planning and more...
Join over 250,000 people reading PlanEasy.ca each year. New blog posts weekly!
Tax planning, benefit optimization, budgeting, family planning, retirement planning and more...


0 Comments