“Safe” Vs “Max” Retirement Spending

If you’re thinking about retirement, then one big question you probably have is how much you can spend in retirement without running out of money in the future.
You probably want to know how much retirement spending your investment portfolio, CPP, OAS and other retirement income can safely support.
In this blog post we’re going to take a closer look at two important levels of retirement spending, your “safe” level of retirement spending and your “max” level of retirement spending.
These are two very important spending levels that every retirement plan should highlight. Your “safe” and “max” level retirement spending represent both lower and upper guardrails for your retirement plan.
“Safe” Retirement Spending
When creating a retirement plan, your “safe” level of retirement spending is when annual retirement spending can be supported even during extremely poor periods of investment returns.
This includes challenging periods like the Great Depression or high inflation of the 70’s and 80’s. These are extremely challenging periods for a retirement plan. A “safe” level of retirement spending will ensure that retirement spending is supported even during these extremely challenging periods.
You may have heard of “safe withdrawal rates” or the “4% rule”. Your “safe” level of retirement spending is based on the same analysis but includes other retirement income sources and personal factors.
To arrive at a “safe” level of retirement spending we run a retirement plan through historical periods of stock returns, bond returns, and inflation rates.
When retirement spending is at a level that is too high, there will be many scenarios that run out of money in the future.
When retirement spending is at a level that is “safe”, there will be very few scenarios that run out of money in the future.
This “safe” level of retirement spending will be different for every person. It depends on many factors like asset allocation, investment fees, tax efficiency, CPP income, OAS income, GIS income, timing of CPP, OAS, and GIS, pension income, annuity income etc.
It’s also important to appreciate that your “safe” level of retirement spending is very pessimistic. It’s a “glass half empty” view of retirement.
It assumes the worst-case scenario and helps you avoid running out of money in those extreme situations. But what if investment returns and inflation rates are close to average or even above average in retirement? Then your “safe” level of retirement spending could leave lots of money in the future.
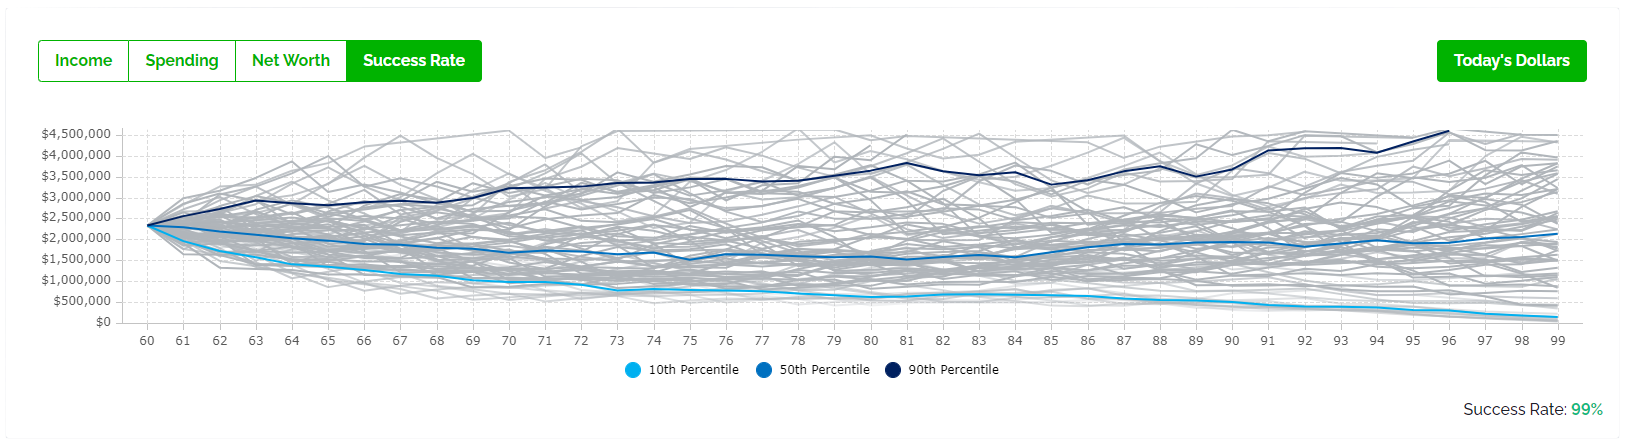
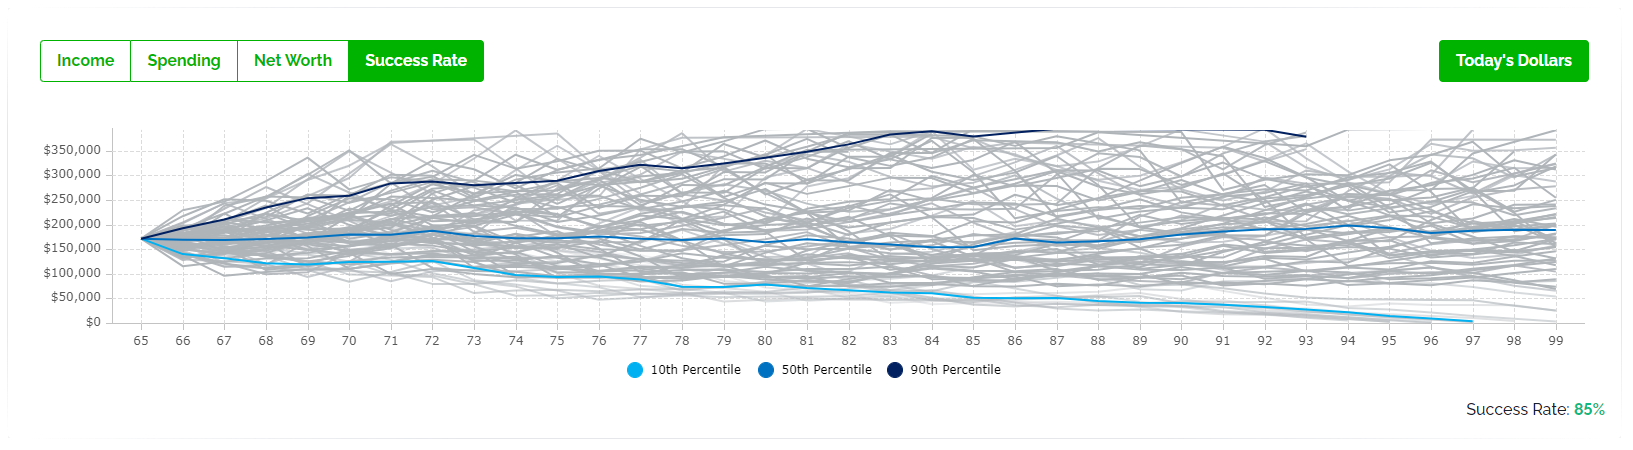
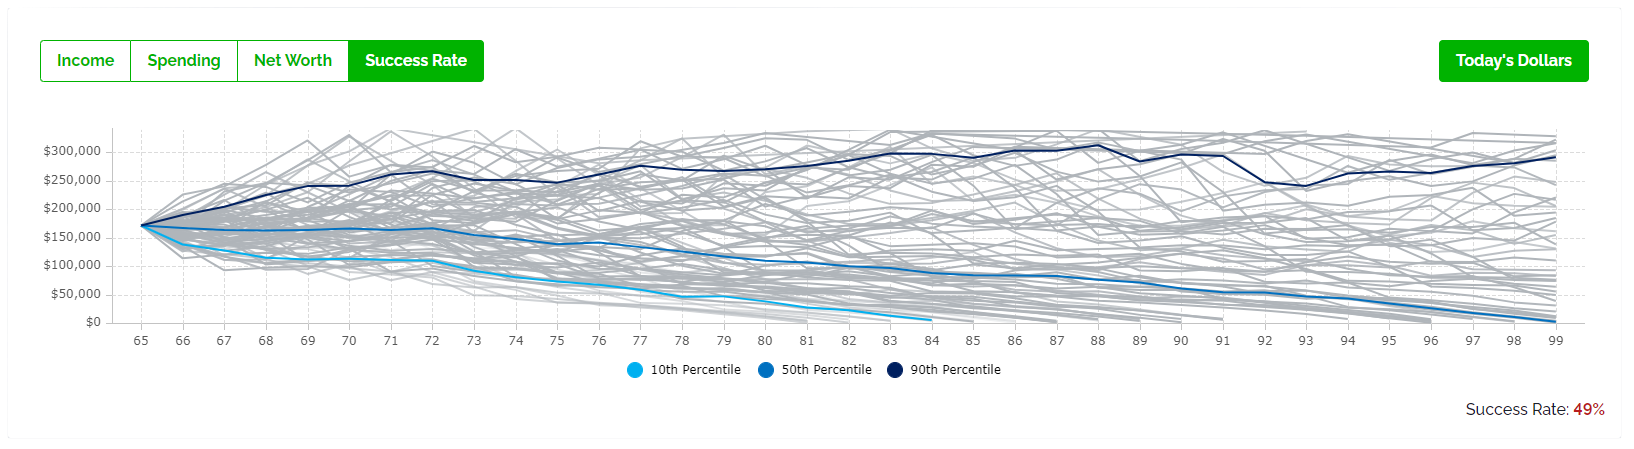
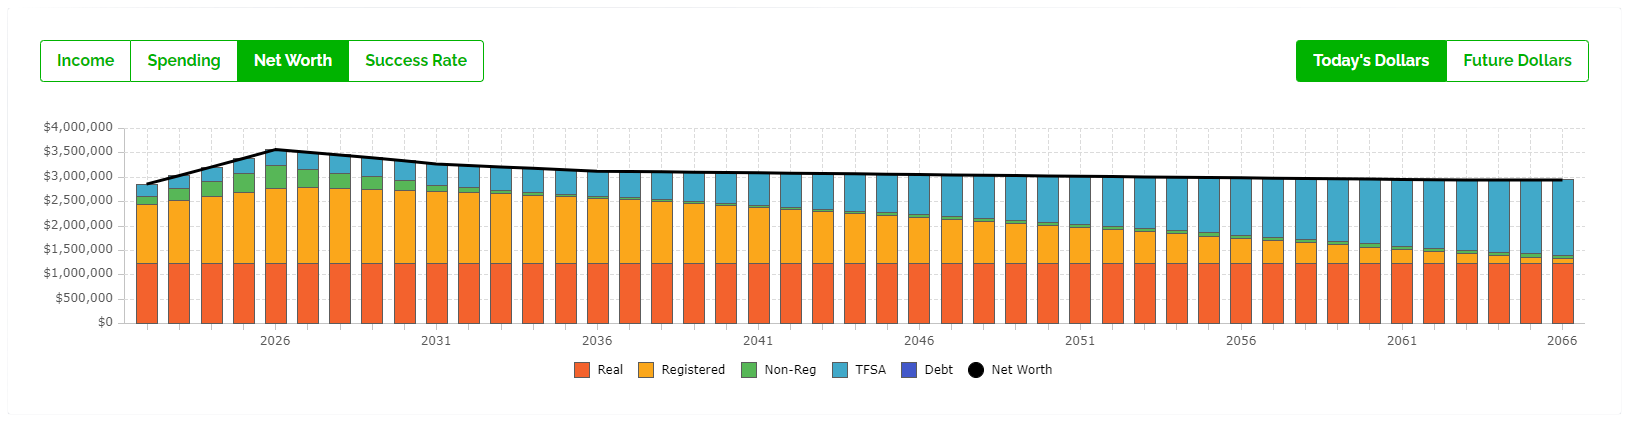
Visually, this is what your safe level of retirement spending looks like when tested against historical periods of stock returns, bond returns, and inflation rates. Every line in this chart represents the exact same annual withdrawals but over different periods of historical returns. A “safe” level of retirement spending will be low enough that the chance of running out of money in the future is very low. But as you can see there are many historical periods that could end up with millions in late retirement. By planning for the worst there is a large opportunity cost. This is why we also want to look at your “max” level of retirement spending.
Free Resources
“Max” Retirement Spending
When creating a retirement plan, your “max” level of retirement spending is when annual retirement spending is supported by investment returns that are average or above average. It represents the highest level of spending a retirement plan could support without the overall success rate dropping too far.
Your “max” level of retirement spending isn’t possible in all scenarios, it represents the upper guardrail for retirement spending, a level of retirement spending that is only supported when investment returns, and inflation rates are in line with expectations or above expectations.
Unlike your “safe” level of retirement spending, which should have a very high success rate and a very low chance of running out of money, your “max” level of retirement spending is riskier and has a higher chance of failure.
For example, a success rate of 50% means that in half of historical periods the “max” level of retirement spending would be supported but in the other half of historical periods a lower level of spending, possibly as low as the “safe” level of retirement spending, might be necessary to avoid running out of money.
It’s important that the difference between “max” and “safe” retirement spending remain entirely discretionary because it may be necessary to reduced spending down to the “safe” level during periods of poor investment returns.
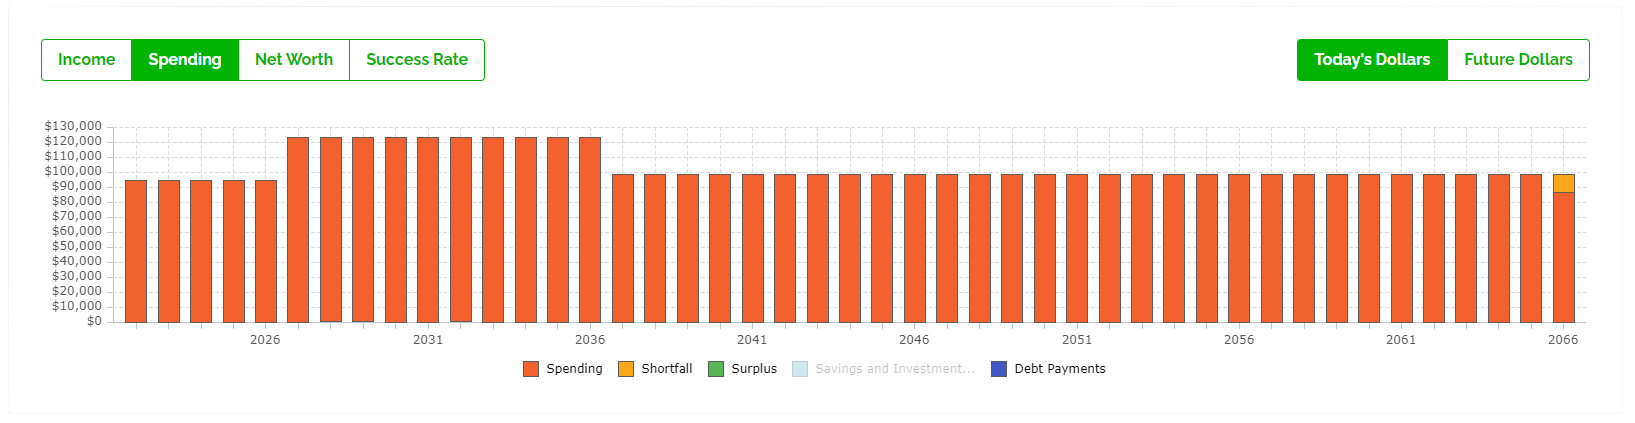
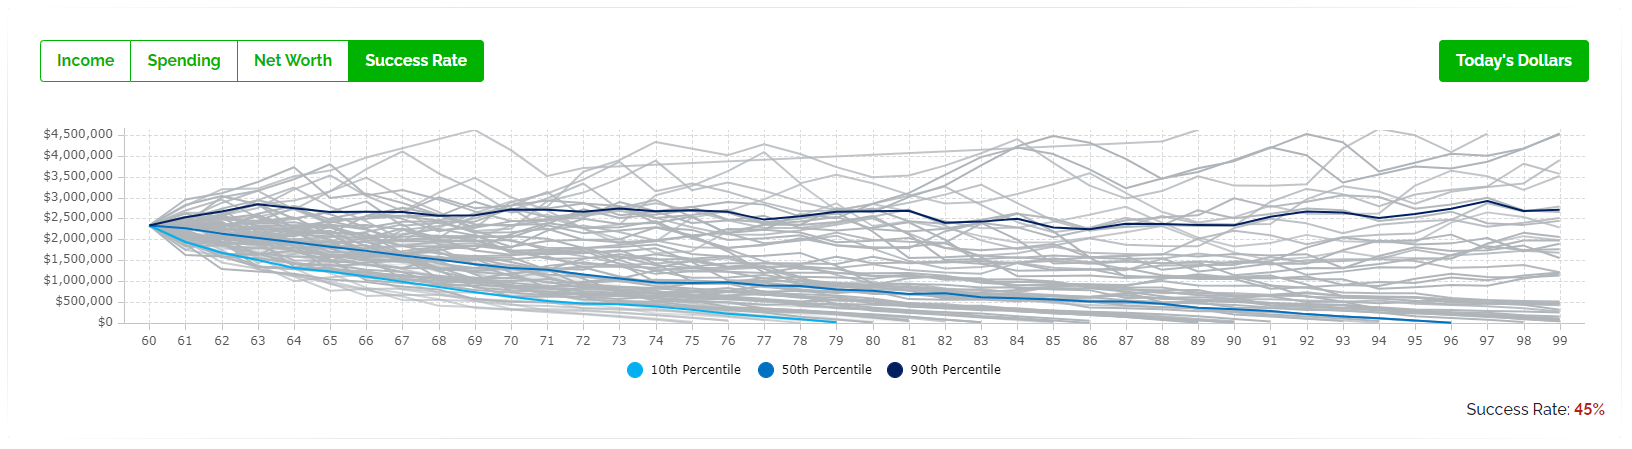
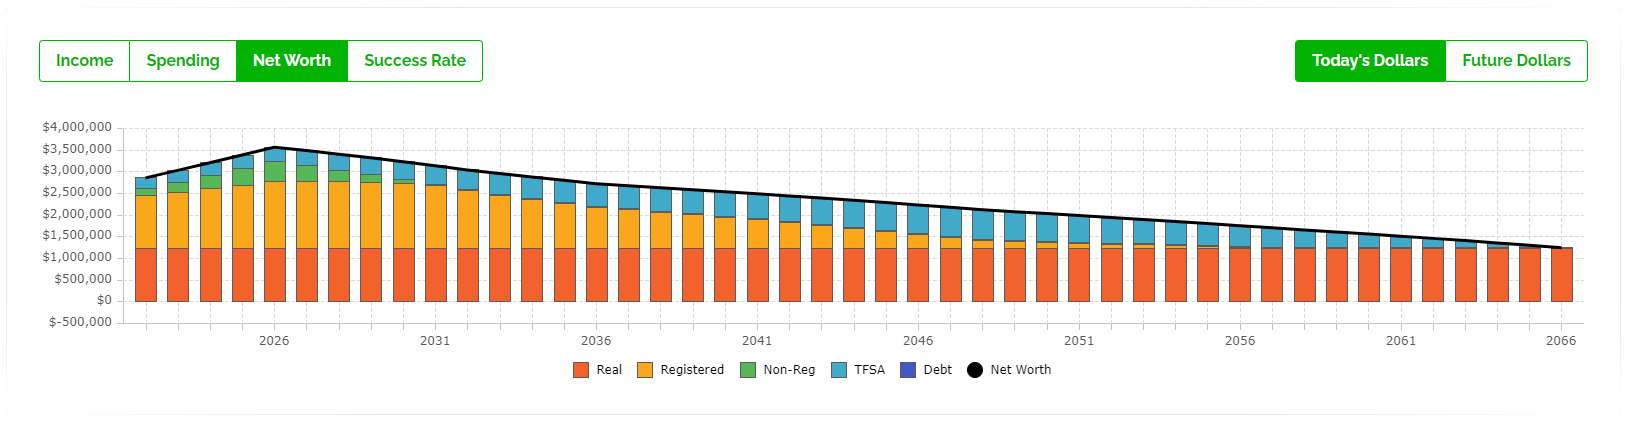
Visually, this is what your “max” level of retirement spending looks like when tested against historical periods of stock returns, bond returns, and inflation rates. Every line in this chart represents the exact same annual withdrawals but over different periods of historical returns. A “max” level of retirement spending will be higher and the chance of running out of money in the future is higher as well. There are many historical periods that could support this higher level of spending but there are also many historical periods that could run out of money in the future if spending remained at the “max” during periods of poor investment returns or high inflation rate.
Watch The Video!
Focusing Only On “Safe” Retirement Spending Is Very Pessimistic
By only planning for a “safe” level of retirement spending there is a good chance that there is a large amount of investment assets left at the end of retirement.
If future investment returns are even a bit better than the absolute worst-case scenario, then maintaining retirement spending at the “safe” level will result in a massive estate in the future.
While leaving a large estate isn’t necessary a problem, it does represent a missed opportunity to spend more during retirement.
If investment returns are average or above average, then there is an opportunity to spend more.
Rather than leaving a large estate it’s possible to spend more in retirement, closer to the “max” level of retirement spending, as long as investment returns remain on track.

Plan For The Worst But Hope For The Best
Planning for a “safe” level of retirement spending is like planning for the worst.
Planning for a “max” level of retirement spending is like hoping for the best.
When creating a retirement plan it’s prudent to plan for the worst it’s also important to hope for the best.
It’s important to plan for the worst-case scenario because this represents a lower guardrail for retirement spending, this is the target level of spending during a recession or depression, but this type of pessimism can potentially limit retirement spending and leave a massive estate in the future.
It makes sense to also plan for a better scenario, this represents an upper guardrail for retirement spending, this is the target level of spending when the portfolio is on track, this scenario is only possible if investment returns are average or above average in retirement, but this higher level of spending will help provide more discretionary spending in retirement and avoid leaving such a large estate.
If this extra spending can remain discretionary and flexible, then it can be advantageous to plan for the worst but hope for the best. As long as investment returns remain on track, then spending in line with your “max” retirement spending is likely very achievable.
Blog post continues below...
Advice-Only Retirement Planning
Are you on the right track for retirement? Do you have a detailed decumulation plan in place? Do you know where you will draw from in retirement? Use the Adviice platform to generate your own AI driven retirement decumulation plan. Plan your final years of accumulation and decumulation. Reduce tax liability. Estimate "safe" vs "max" retirement spending. Calculate CPP, OAS, GIS, CCB etc. And much more!
Start your retirement plan for just $9 for 30-days!
You deserve financial peace of mind as you enter retirement. Start planning now!
Example #1: Low-Income Retirement Plan
The difference between “safe” and “max” retirement spending is different for everyone. It depends on many factors like asset allocation, investment fees, the size of the investment portfolio, other retirement income like CPP, OAS, GIS, pensions etc.
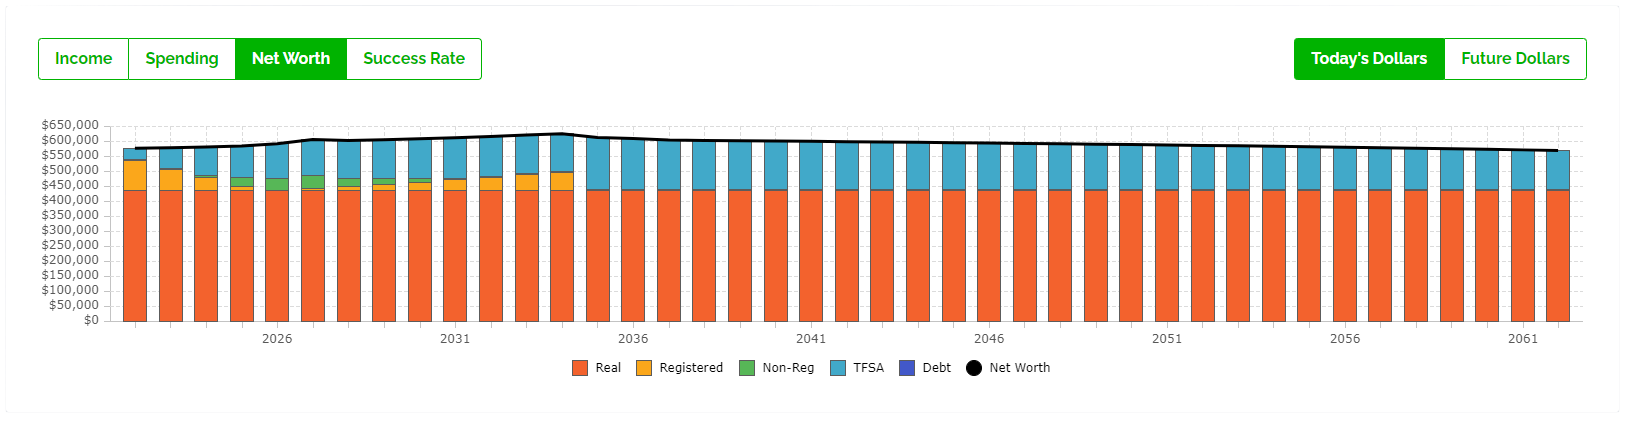
In this example we have Mary who expects to receive GIS benefits in retirement. With some careful planning Mary has improved her retirement plan and maximized her GIS benefits. This has improved Mary’s success rate to 85%. Mary can spend nearly $30,000 per year and have a good chance of never running out of money in the future. This represents Mary’s “safe” level of retirement spending.
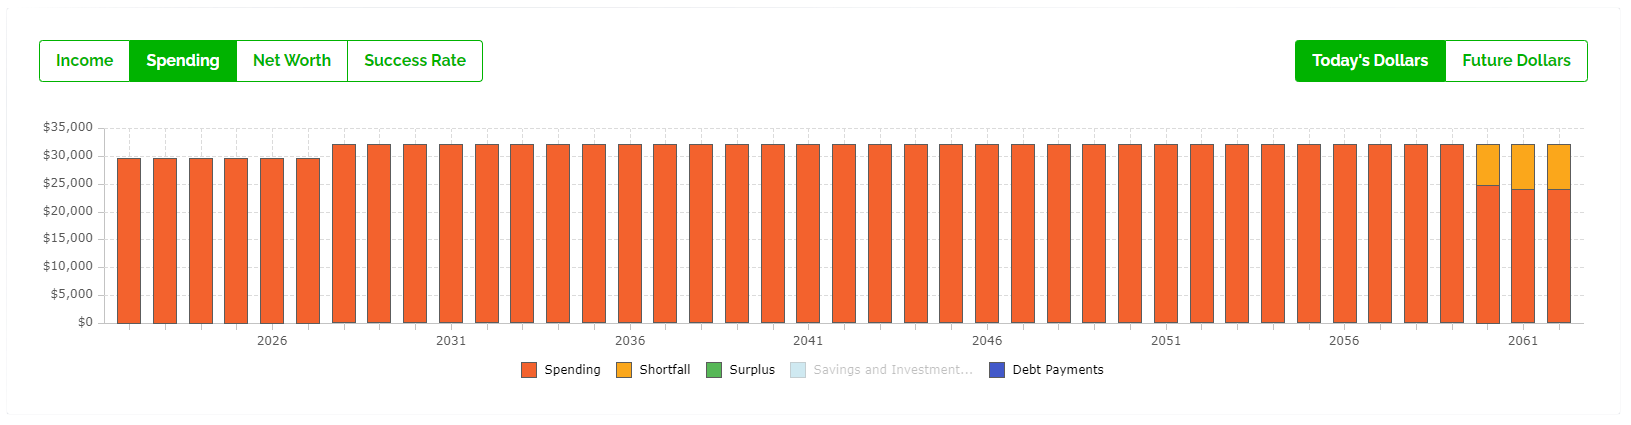
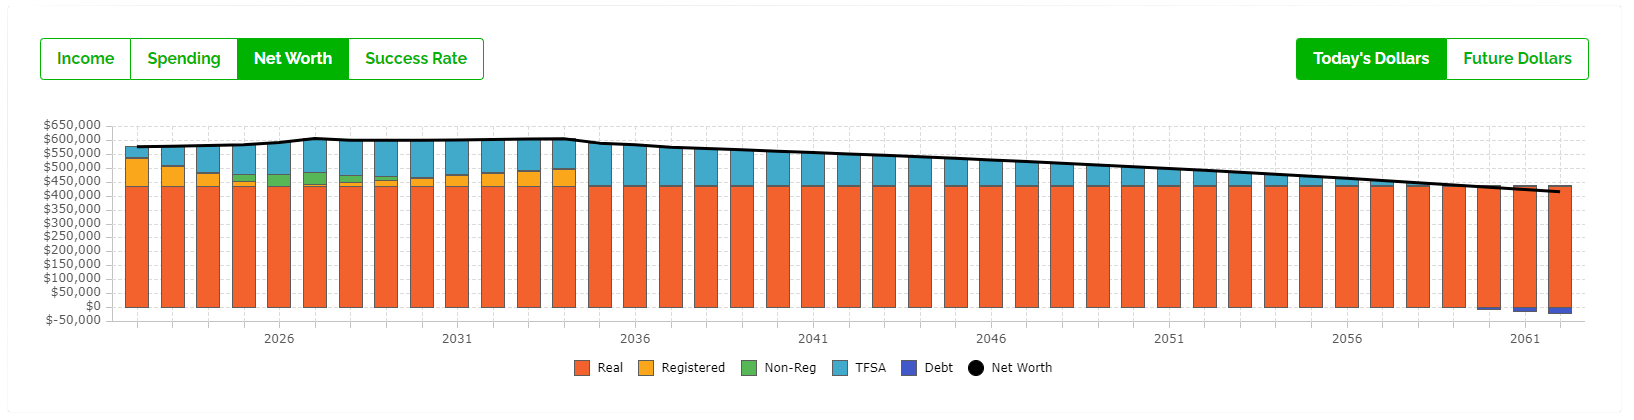
But if investment returns remain on track, then Mary may leave a very large TFSA in the future. Mary could spend up to $2,500 more each year as long as investment returns are average or above average. This decreases Mary’s success rate. This represents Mary’s “max” level of retirement spending.
Because the majority of Mary’s retirement income is being supported by CPP, OAS, and GIS benefits, the investment portfolio only makes up a small portion of Mary’s future retirement income. This means that the difference between Mary’s “safe” and “max” retirement spending is quite small at $2,500 per year. It is very important for Mary to stay on track with spending because there isn’t much “wiggle room” within the plan.
“Safe” Level of Retirement Spending For Mary: $29,589 per year
See this scenario: https://public.planeasy.ca/dashboard/365d-kJlanqakOKTG
“Max” Level of Retirement Spending For Mary: $32,089 per year
See this scenario: https://public.planeasy.ca/dashboard/365d-iKYQwfPoGypk
Example #2: High-Income Retirement Plan
Sylvia and Martin on the other hand have a very large investment portfolio that will support the majority of their retirement income. Although they do have CPP and OAS benefits, the investment portfolio supports the bulk of retirement spending.
This means that Sylvia and Martin are a bit more susceptible to changes in investment returns and inflation rates. They experience more of the upside but also more of the downside. This means they have a much larger range between their “safe” and “max” retirement spending.
If they only focus on their “safe” level of retirement spending, then their retirement plan will look much more pessimistic.
If they also look at their “max” level of retirement spending, then they’ll see that they can potentially have a large amount of discretionary spending each year as long as investment returns remain on track in retirement. They only need to adjust their retirement spending if they portfolio balance falls below the level in the “max” scenario.
This provides Sylvia and Martin with both a lower guardrail and an upper guardrail for their retirement plan with a possible $24,000 in additional discretionary spend each year as long as investment returns remain on track.
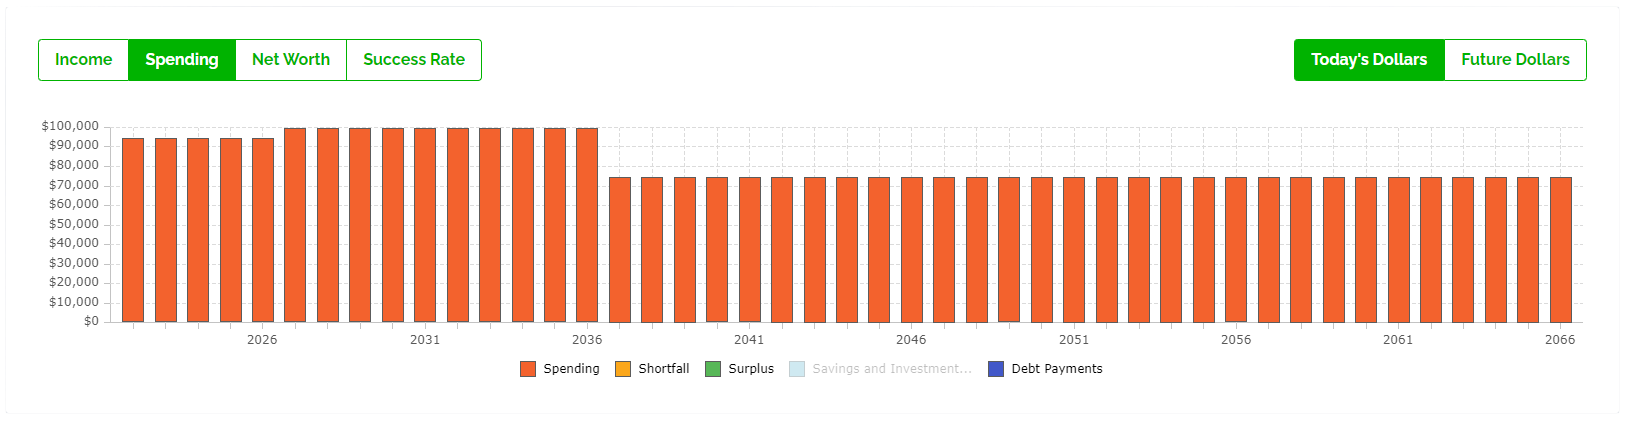
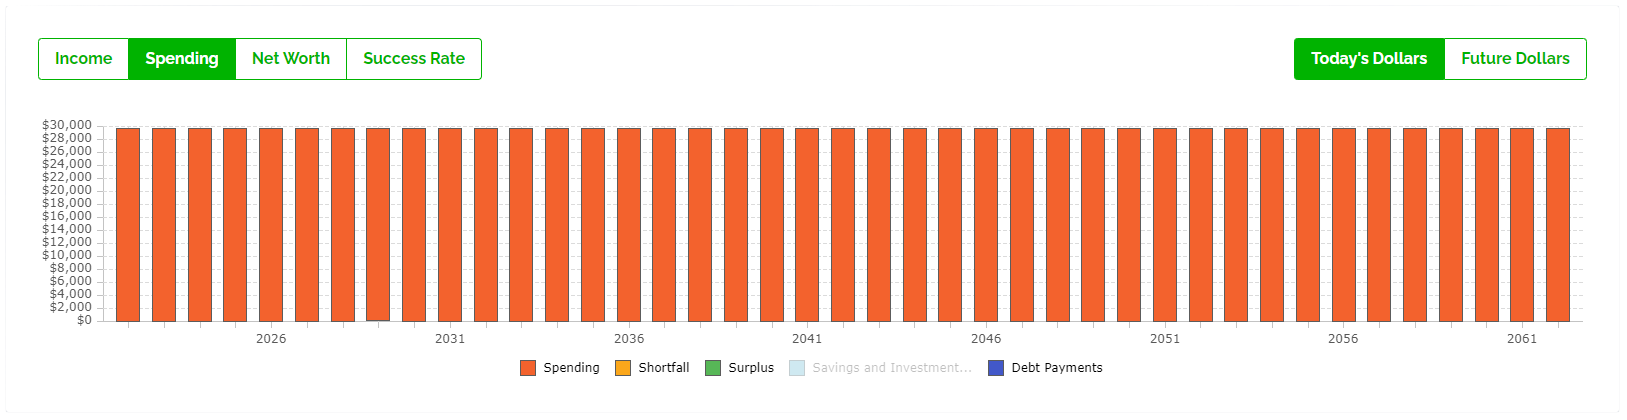
“Safe” Level of Retirement Spending For Sylvia and Martin: $99,082 per year
See this scenario: https://public.planeasy.ca/dashboard/365d-M6MM5zypJwnN
“Max” Level of Retirement Spending For Sylvia and Martin: $123,082 per year
See this scenario: https://public.planeasy.ca/dashboard/365d-C76ns2J1fB44
Join over 250,000 people reading PlanEasy.ca each year. New blog posts weekly!
Tax planning, benefit optimization, budgeting, family planning, retirement planning and more...
Join over 250,000 people reading PlanEasy.ca each year. New blog posts weekly!
Tax planning, benefit optimization, budgeting, family planning, retirement planning and more...


Do you have a analysis or comparison of collapsing a RRIF/RRSP over x years that results in the minimum tax and GIS clawbacks?
ie: For a moderate RRSP of 100k it may be better to withdraw it all in 2 years, forgo GIS then get max GIS rather than just withdrawing the minimum each year and losing more GIS in the long term
Oh yes Marti! You may enjoy this case study, it highlights the exact situation you’re describing…
https://www.planeasy.ca/case-study-low-income-retirement-plan/
You might also like this blog post that highlights 5 strategies to help maximize GIS benefits…
https://www.planeasy.ca/5-strategies-to-help-increase-guaranteed-income-supplement-gis-by-up-to-100000/