The Best Parts Of A Financial Plan

Financial planning is a fascinating process. When building a financial plan there are equal parts of finance (math, numbers, money etc), and personal (values, goals, risk aversion etc). This makes every financial plan unique. No two financial plans are the same. Even when two people start with the exact same income, assets, debt and expenses, the fact is their plan will differ because they have different goals and personal values.
Even though the plan may differ, there are certain parts in a financial plan that never change. There are net worth projections, income projections, cash flow planning, income and expenses etc etc.
In this post, I’m going to highlight some of my favorite parts of a financial plan. These are what I would consider to be the best parts of a financial plan, the most interesting, the best of the best. But it doesn’t represent everything. There are many great parts of a financial plan and the “best” part can differ from plan to plan.
For example, we won’t talk about government benefits below, but for many households, especially those with children under the age of 17, government benefits play a big role in their financial plan. We recently did a plan for a young family where a few small changes allowed this family to reduce their income tax and increase their government benefits by $100,000+ over the course of their plan! That would definitely be the best part of that plan!
What we will cover in this post are net worth projections, debt payoff plans, planning around different income sources, and how we understand the “success rate” of a plan.
Related Posts:
- Optimizing Your Government Benefits: Both Now and In Retirement
- Are You Saving Too Much for Retirement?
- Where Are You in the Financial Planning Life Cycle?
Net Worth Projections
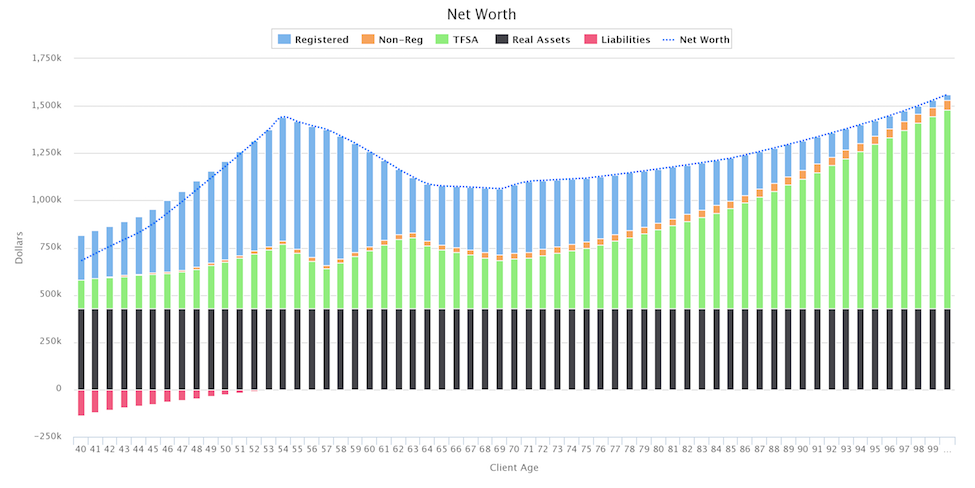
Net worth projections have to be one of my favorite parts of a financial plan. It’s incredible to see how net worth grows prior to retirement and then declines as withdrawals are made.
Net worth represents a lifetime of work, a lifetime of saving, and a lifetime of smart investing.
The net worth chart doesn’t actually tell us too much about the strength of our plan. It includes real estate, which in the case of a primary residence, may never be sold. It also typically assumes an average rate of return, which is entirely unrealistic. The truth is that net worth will fluctuate with investment returns and could be ahead of plan one year and then behind plan the next.
Still, net worth is one of my favorite parts of a financial plan and it can be a great number to track against as you put your plan into action. It provides a great benchmark to evaluate your progress vs your plan each year (as long as you’re comfortable with the fact you have no real control over it in the short-term because investment values will fluctuate wildly from year to year!)
Free Resources

Debt Payoff Plan
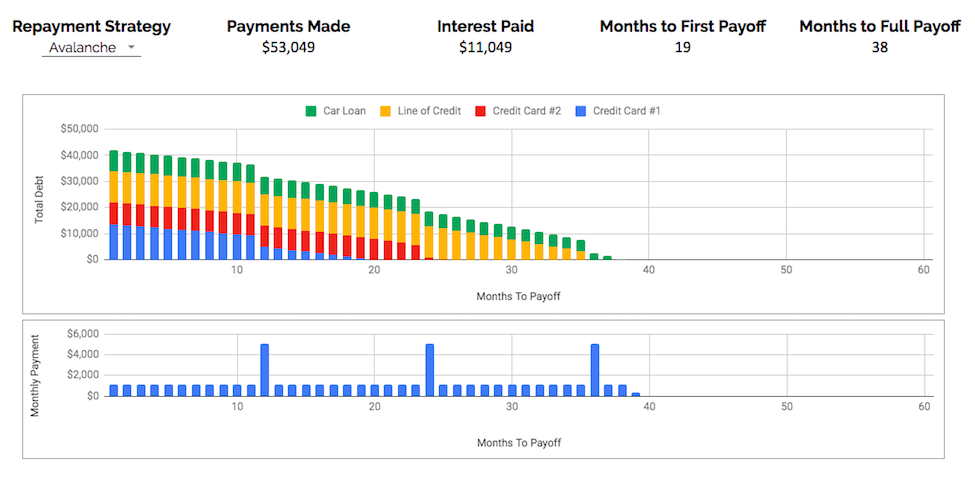
A good debt payoff plan is amazing. There’s something very satisfying about slowly knocking down your debt over time. Debt payoff plans can take years, and if it includes a mortgage, it can take decades.
The satisfying thing about a debt payoff plan is the predictability. Unlike the net worth chart, which depends on unpredictable investment returns, the debt payoff plan uses your actual interest rates, which don’t change very much (if at all).
Once you make a debt payoff plan it’s unlikely to change drastically in the future (the only exception would be with debt instruments that are linked to the prime rate, like variable rate mortgages or HELOCs).
When we paid off our mortgage early we made a detailed mortgage payoff plan. It was our first big financial goal and we found it extremely motivating. We made all kinds of lifestyle changes to help us achieve our goal.
The great thing about a debt payoff plan is that any extra effort provides immediate results, and this can be extremely motivating. Using a debt payoff calculator (like the one we have for free in the resources section), you can make a debt payoff plan and see the impact of your extra savings or extra income immediately…
“Did you find a way to save an extra $100 per month to go towards your debt? That’ll cut your debt payoff time by 3 months!”
“Going to put your entire $5,000 bonus against your debt? That’ll cut your debt payoff time by 1-year!”
Planning Income Sources
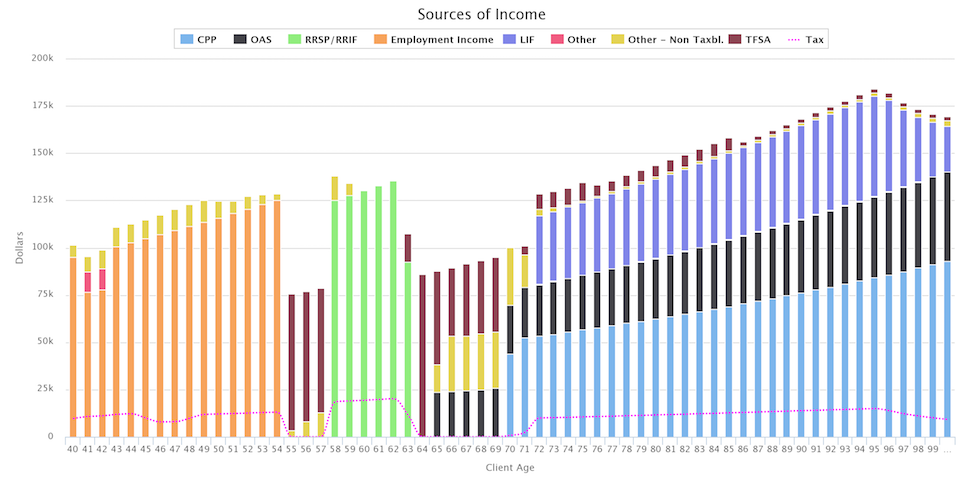
This is a client favorite and a favorite of mine as well. The income source chart can be incredibly interesting, especially in retirement when we’re switching between different income sources to try to reduce income taxes and/or qualify for certain income tested benefits.
Prior to retirement most of us have one or two income sources. We probably have some employment income and we may also receive some government benefits (especially for families who receive the Canada Child Benefit while their children are under the age of 17).
After retirement however, the number of income sources EXPLODES! Suddenly, we’re making withdrawals from RRSPs/RRIFs, LIRAs/LIFs, TFSAs and non-registered accounts. We may also have payments from a defined benefit pension plan plus there are also government pensions like CPP and OAS. Then, depending on income level, we may also have government benefits like GIS at lower income levels, or at moderate income levels we may also have refundable tax credits like the GST/HST credit or property tax credits.
The net result is that it’s not uncommon to have between 5 and 10 different income sources in retirement. Planning all these different sources of income can be challenging, they all have different withdrawal rules, tax rates, and claw back rates.
The income sources chart does a nice job summarizing all that craziness into one neat visual, and I personally love it.
Sequence of Returns Risk (aka Success Rate)
As we already mentioned, the net worth chart doesn’t really mean much, it assumes a constant rate of return, which isn’t likely to happen from year to year. A constant rate of return might make sense over the long-run, but the reality from year to year will be very different. This sequence of returns risk is the biggest risk in retirement.
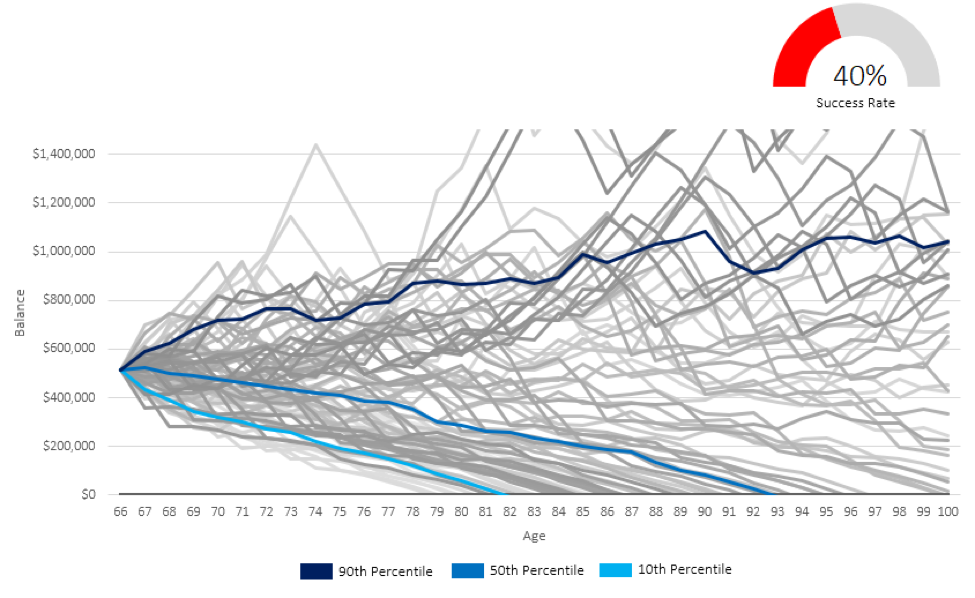
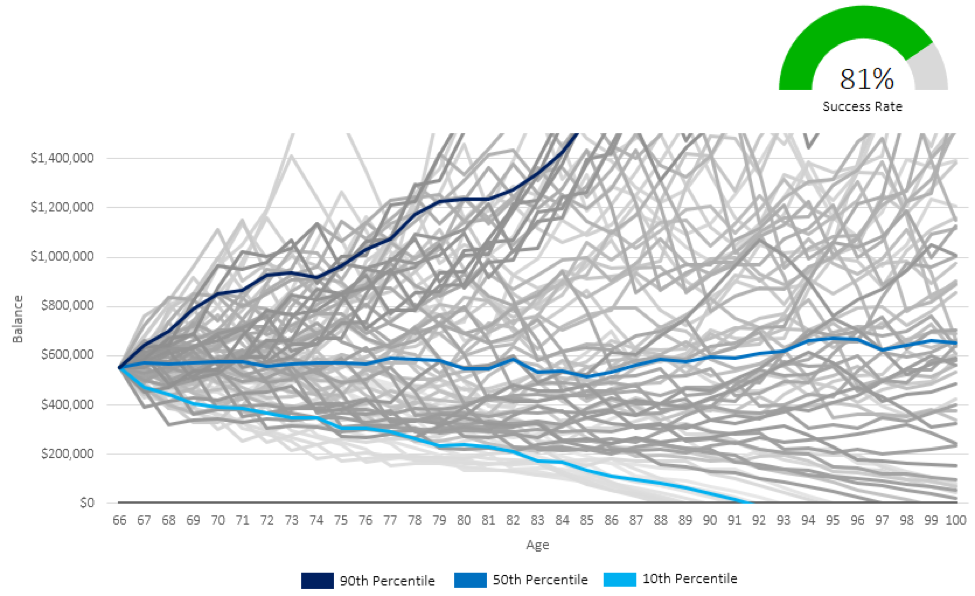
The success rate chart on the other hand is very real. It’s the real performance of our plan if we took it back in time. The success rate chart takes our investment assets and withdrawal plan and goes back to prior years. It helps us understand how our plan would have performed with historical stock, bond, and inflation rates.
Each line in the success rate chart represents our plan as if we had retired in 1901, 1902, 1903, 1904 etc etc etc. It tells us how our plan would have performed during the great depression, or how it would have performed during the high inflation of the 1970’s.
Success, in this case, means making it to the end of our plan without running out of money.
We don’t necessarily want to be successful in 100% of historical periods, for most people that would be too conservative. But we do want to understand how often we might need to make changes to our spending to ensure success. If 1 out of 10 historical periods fail, then we want to ensure we have a plan to cut back on discretionary spending just in case we were to find ourselves in one of those unique situations in the future.
The Best Parts Of A Financial Plan
There are many great parts to a financial plan, many more than I’ve covered in this post. If you’re interested to see what a full financial plan looks like, click the “Start Planning” button in the menu and start a financial plan with us. It’s just a short survey to see if we’re a good fit, there is no obligation, the first discovery meeting is entirely free, and we’ll send you a full financial plan via email too.
Creating a financial plan has many benefits, from soft benefits like peace of mind, to hard benefits like tax and benefit optimization, to planning benefits like knowing how much to save prior to retirement or when to draw from RRSP vs TFSA vs non-registered etc.
If you’ve never had a financial plan done, then complete the “Start Planning” survey and let’s meet to see if we’re a good fit! Look forward to talking with you!
Join over 250,000 people reading PlanEasy.ca each year. New blog posts weekly!
Tax planning, benefit optimization, budgeting, family planning, retirement planning and more...
Join over 250,000 people reading PlanEasy.ca each year. New blog posts weekly!
Tax planning, benefit optimization, budgeting, family planning, retirement planning and more...


Hi Owen. Here is a link to a post by Michael Kitces regarding retirement spending. Thought you might be interested even though it is US based. Cheers.
https://www.kitces.com/blog/the-problem-with-fireing-at-4-and-the-need-for-flexible-spending-rules/
Fantastic Garth, thank you for sharing! Having flexibility in retirement is very valuable, and a clear understanding of what “core” spending is vs “discretionary” spending is important. I always ask clients to itemize their current and retirement spending by category, even if they don’t currently budget that way. A few question the effort involved but it’s an important way to understand how much flexibility exists within their retirement budget (in addition to the other benefits of having a detailed spending estimate!).
I also believe it is important to understand the extreme range of possible outcomes (good and bad) that are possible when one is exposed to the market. This was a big revelation to me! Market risk cannot be avoided…invest we must. True flexibility allows retirees to take advantage of good return sequences and to eliminate the risk of a bad sequence. The price to be paid is having to accept spending variability and to have a lot of slack in the budget…