Three Ways To Visualize Your Financial Goals

Goals are a fantastic way to motivate yourself. Having a big, ambitious goal will help you prioritize other things in your life. It gives you something to work toward. Something that you care deeply about. It helps you balance what you need today with what you want to achieve in the future.
Financial goals have made a huge difference in my life. Setting powerful financial goals has helped me focus on the things that matter to me and ignore the things that don’t. They’ve helped me prioritize my spending to better align with my short and long-term goals.
Because of these financial goals, I’ve cut $1,000’s per year in wasteful spending. Spending that really didn’t provide much value to me. Spending that was mostly driven out of habit. Spending that I’d gladly cut in favor of my long-term goals.
Once you have a financial goal then you have to track it. And this can be a challenge on its own.
One thing that helps me reach my financial goals (or any goal for that matter) is to track my progress visually.
Maybe I’m a visual person but I find it helps me to “see” where I’ve come from and where I’m going. It’s super motivating to see that I’m hitting my monthly goals and that I’m on track to hit my long-term goal.
There are a few different ways to visualize your goals. I’m going to share my three favorite visualization techniques with you.
Graphs & Charts & Tables
Obviously financial goals will be numbers based. Saving, investing, paying down debt, creating an emergency fund, these are all goals that can be quantified. This makes it easy to use graphs, charts and tables to track your progress.
Spreadsheets like Google Sheets make this easy and (best of all) free! You can even link your Google Sheet to a Google Form so that you can easily update your goal tracker without opening the spreadsheet. (Check out this short video to see how it works)
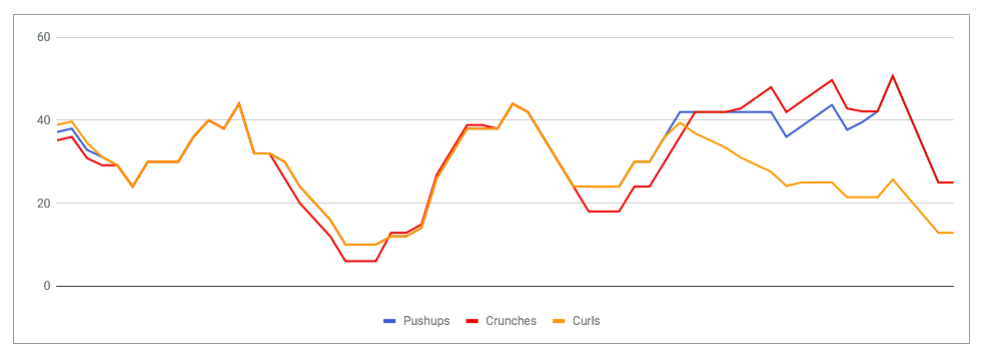
This also works for non-financial goals. Here is a simple graph I put together using Google Sheets to track my daily exercise. Along with biking to work, this spreadsheet helps me track my fitness level. It’s acts as a great reminder when I start to slip out of my routine (yes, I’ve been slacking the last few days!)
Print Outs Or Post-It Notes
Spreadsheets are great but what about something even more visual and maybe even tactile?!?
Another method I love is the old-fashioned print out. I’m not sure why but printing something out makes it seem very real to me.
The idea is simple. Take your monthly goal and print it out on a piece of paper and hang it somewhere visible.
For example, if your goal is to pay off your debt over the next 23 months you would print 23 pieces of paper with your monthly payment of $536 on it. Then hang these pieces of paper on a wall, on the back of your closet door, or in any visible place to act as a daily reminder.
Each month when you hit your goal you take down a piece of paper or mark it out with a big X.
Just the act of taking down a piece of paper can provide a ton of satisfaction which gives you motivation to keep working towards your goal.
“Setting powerful financial goals has helped me focus on the things that matter to me and ignore the things that don’t.”
Progress Maps & Goal Trackers
If you want something more visually stunning, then I recommend a progress map.
Progress maps are graphic designs that you colour in as you hit your monthly goals. As you work towards your goal it provides a great visual reminder of your progress. Colouring in each section of the progress map can be extremely satisfying.
Progress maps come in all sorts of designs. You can find them on Pinterest, Google or on websites that specialize in printable progress maps.
A beautifully designed progress map can be framed and hung in a prominent place like a piece of art. This provides a great visual reminder and helps keep you on track when things get difficult.
How do you use the power of visualization to reach your goals?
Join over 250,000 people reading PlanEasy.ca each year. New blog posts weekly!
Tax planning, benefit optimization, budgeting, family planning, retirement planning and more...
Join over 250,000 people reading PlanEasy.ca each year. New blog posts weekly!
Tax planning, benefit optimization, budgeting, family planning, retirement planning and more...


Wow that graph looks really nice!! So Google Sheets can turn into graphs? I should look into this. I’m terrible at Excel, one of the things I want to work on when I retire haha.
Yes! Google Sheets is great for graphs/charts and best of all it’s free! It doesn’t have quite as many features as Excel but for 90% of people I don’t think they’d notice.