Being Too Conservative Can Increase The Risk Of Running Out Of Money In Retirement

When it comes to retirement planning, one of the biggest fears is often the risk of running out of money. It can be worrisome to think about what could happen if you’re unable to support your expenses in the future.
Sometimes these fears can lead to people choosing a more conservative risk profile, or holding a lot of cash, but taking these defensive measures can often increase the risk of running out of money in the future.
A more conservative asset allocation decreases market risk, the risk we take on when we invest in the stock market. But a conservative asset allocation actually increases other types of risk, like the risk of running out of money, or the risk of being impacted by high inflation rates.
A more conservative asset allocation can actually increase risk in retirement, especially for longer retirement periods. Your typical 30-40 something couple has a very good chance of either one making it to age 100+ in the future. There is a 25% chance that one of them will make it to age 98 and a 10% chance that one of them will make it to age 101!
Without making other changes, like a lower withdrawal rate, more flexibility with spending, part-time income etc, being more conservative can actually lead to a much higher probability of running out of money before age 100.
Let’s explore why this is the case and what you need to consider when creating your retirement plan…
Related posts:
- Avoiding The Risk Of A Long And Healthy Life
- The Biggest Risk In Retirement Is Sequence Of Returns Risk
- The Best Parts Of A Financial Plan
Inflation Rate Risk
When we think about risk in retirement, we often think about investment risk. This is the risk we take when we invest in stocks and/or bonds.
But there are lots of other risks we face and one important kind of risk is inflation rate risk. This is the risk of higher inflation rates in the future. Inflation increases the cost of goods and services. As inflation increases, we need to ensure our investments increase as well.
Stocks have a better chance of keeping up with inflation. Each individual business has the ability to increase the price for their goods and services. In fact, this is exactly what inflation represents, it’s the price increase on the goods and services we purchase. When we invest in stocks we have a natural hedge against inflation because businesses are able to increase their prices as inflation increases (obviously every business is impacted by inflation differently, so this may not be true on a case-by-case basis).
Fixed income products unfortunately do not have the same ability to keep up with inflation. In fact, bonds are very susceptible to changes in interest rates, so if there is an increase in interest rates as a way to control inflation then bond prices may suffer.
The Impact Of A Lower Rate of Return
The other important impact that a conservative portfolio has on a retirement plan is that we have to assume a lower rate of return. There is a natural link between risk and return. In general, the more risk, the more return. A higher investment return is the way that investors are compensated for taking on increased risk.
By choosing a more conservative portfolio, the long-term rate of return expectations needs to decrease. If we assume a 3% risk premium for stocks vs bonds, then every 10% shift towards bonds will reduce the overall expected return by 0.3%.
Based on those assumptions, going from an assertive 75/25 portfolio of stocks/bonds to a balanced 60/40 portfolio might mean we could expect a 0.45% decrease in long-term return. Going from an assertive 75/25 portfolio to a cautious 45/55 portfolio might mean we could expect a 0.90% decrease in long-term return. And going from an assertive 75/25 portfolio to a conservative 30/70 portfolio might mean we could expect a 1.35% decrease in long-term return.
Those decreases in long-term return can have a significant impact on our ability to create income in retirement. This lower return creates more risk of running out of money in retirement.
Historical Results For Various Risk Profiles
We can see the impact that a more conservative risk profile has on retirement by looking at historical scenarios of stock returns, bond returns and inflation rates. By taking actual historical data we can measure how successful each risk profile is at avoiding the risk of running out of money in retirement.
Disclaimer: Historical scenarios are one way to test a financial plan, but it’s not a perfect representation of the results we could expect in the future. As they say “past performance is no guarantee of future results”.
In the examples below we’ll assume a few things…
- Historical rates of return (stock, bond, inflation rate)
- Equities are equally split between Canada, US and Global
- A starting portfolio of $1,000,000
- An annual draw of $40,000 that increases with inflation
- A 40-year retirement period from age 60 to age 100
- Investment fees of 0.16% per year
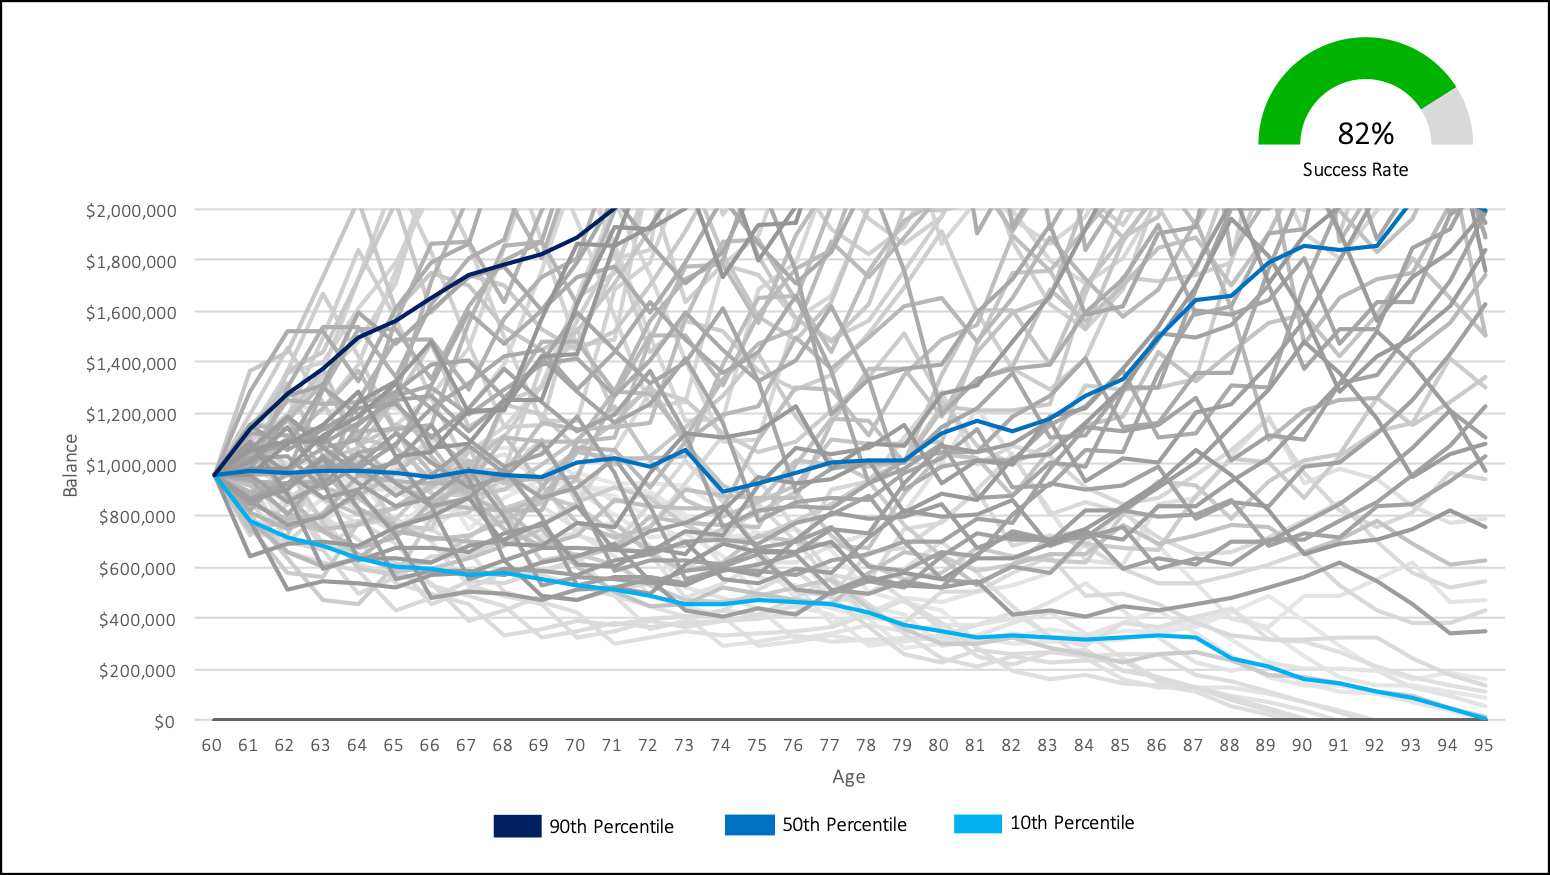
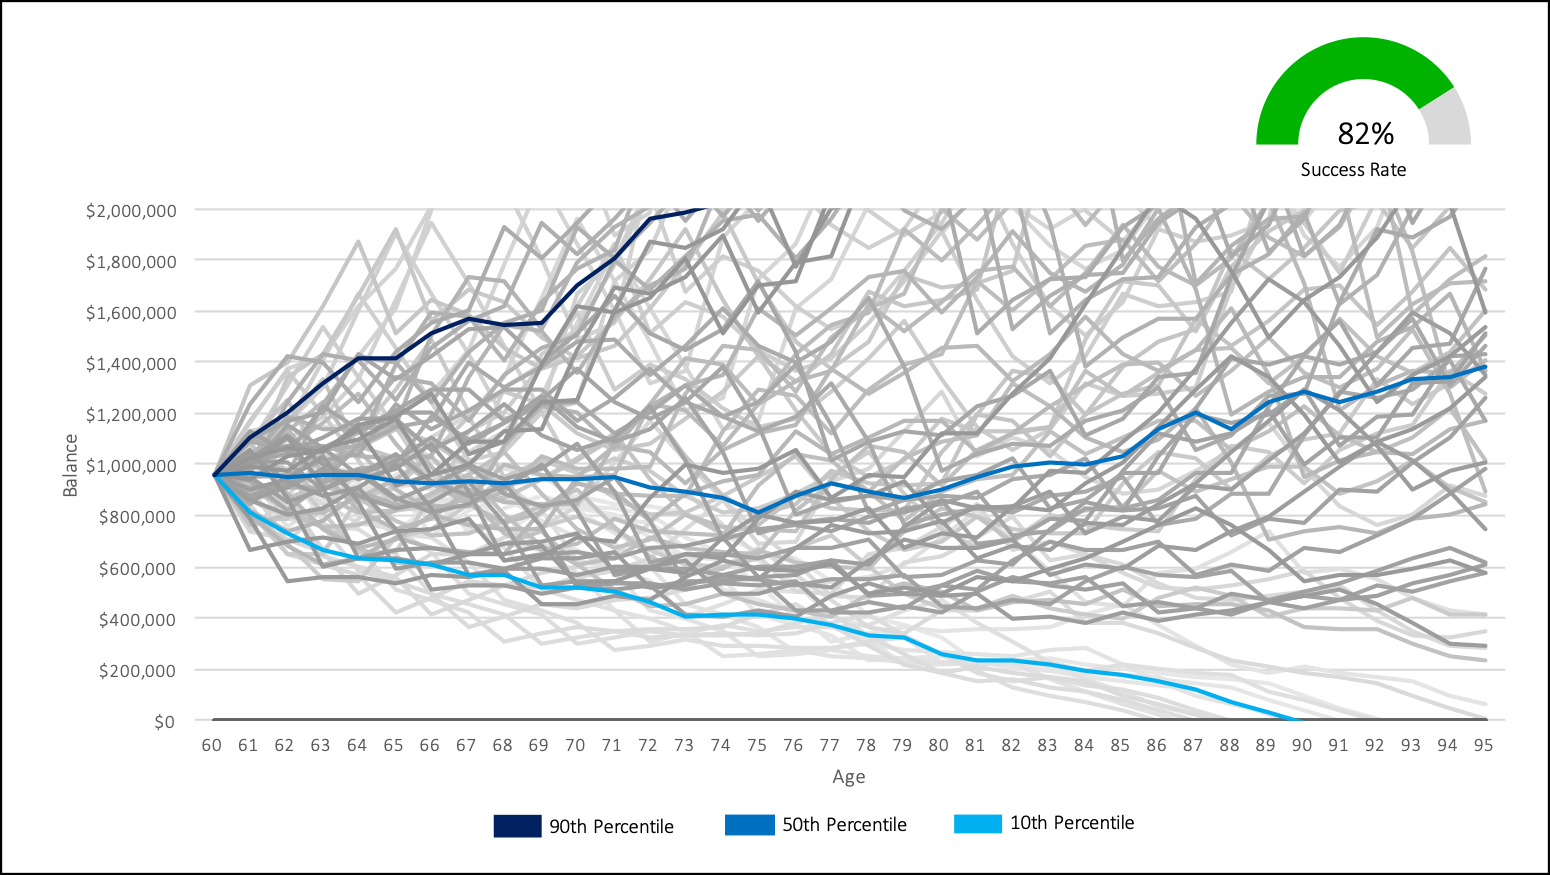
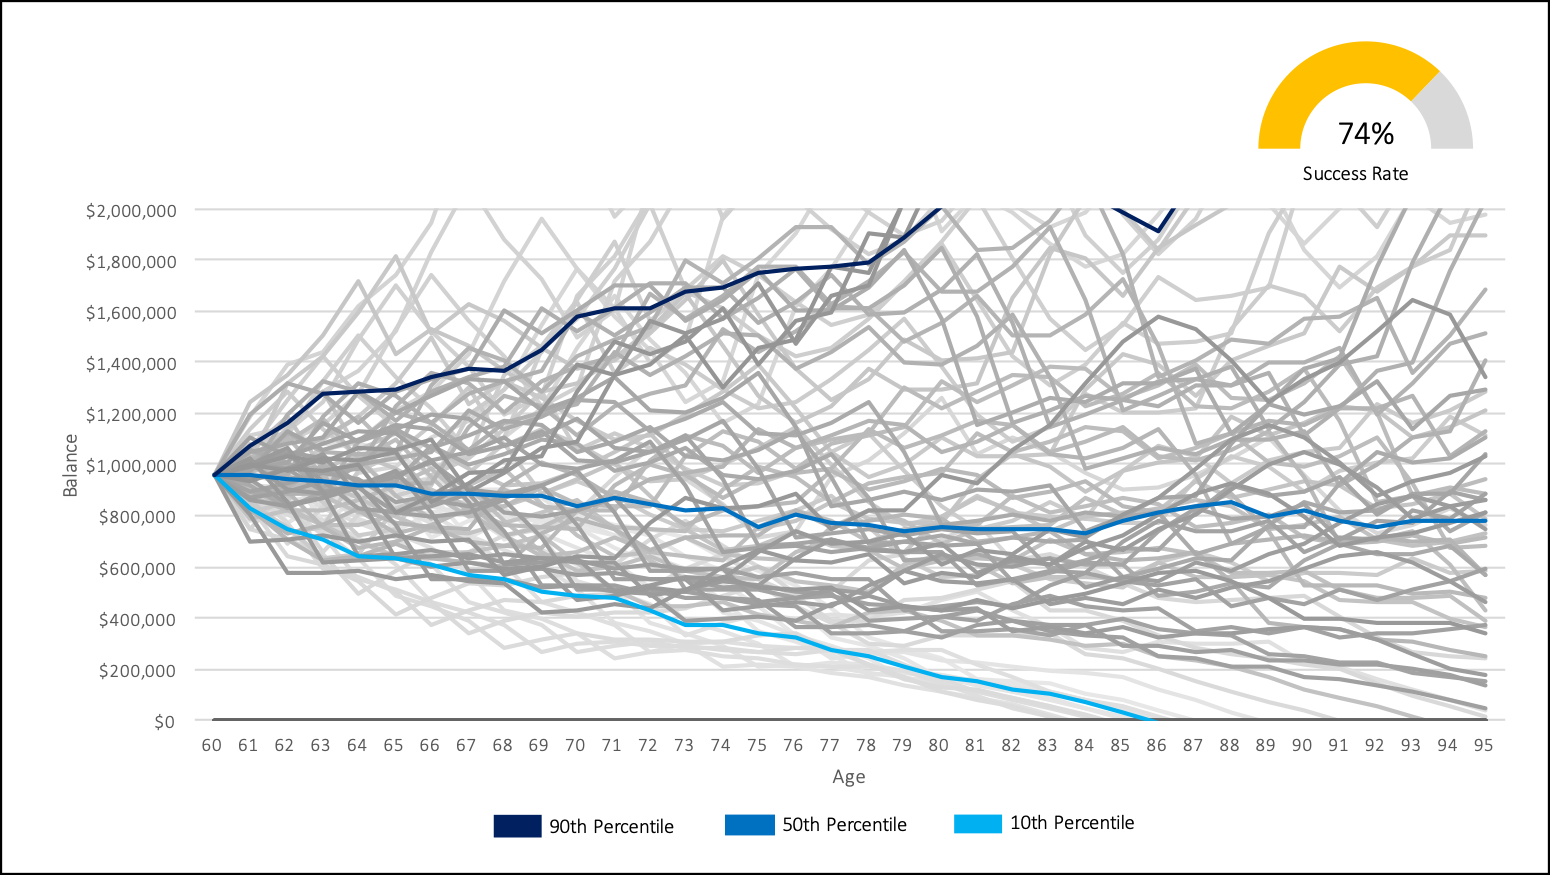
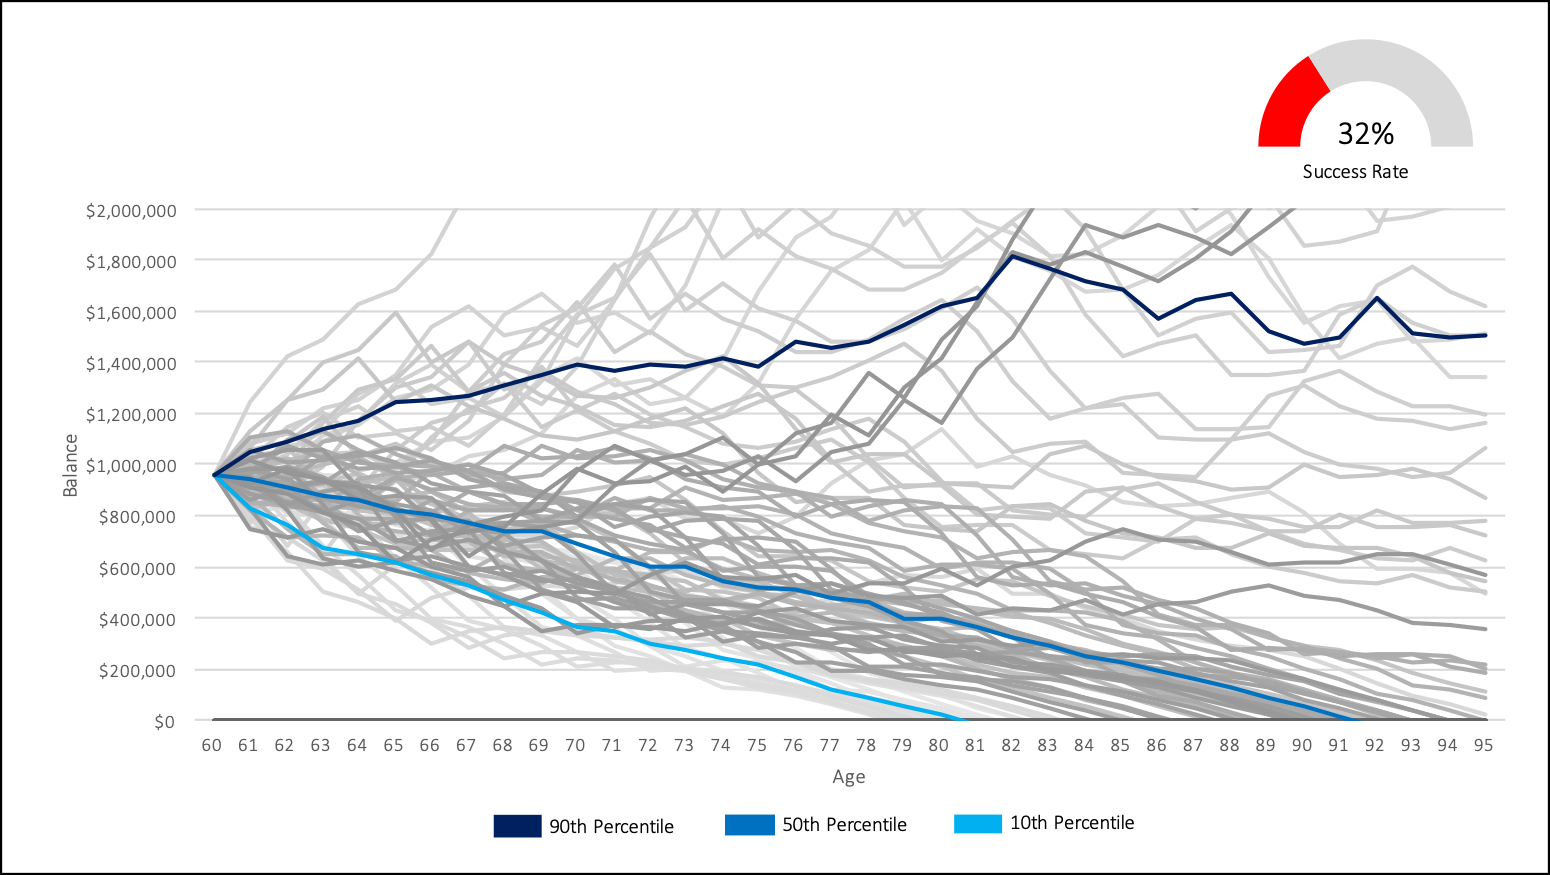
In each example below we assume “success” is when we can reach age 100 with at least some investment assets left over (even if that’s just $1). Each line in the chart represents one historical period of 40-years. It could be 1901 to 1941, or 1929 to 1969, or 1972 to 2012 etc etc
Its important to point out that investment fees will have a large impact on the success rate. The drag caused by high-investment fees can greatly increase the chance of running out of money in the future.
The charts below clearly show the increased risk of running out of money as the investment portfolio gets more and more conservative. It’s always important to choose an investment allocation that fits your personal risk profile, but it’s also important to ensure that you understand the impact that a more conservative risk profile can have on long-term returns. A more conservative risk profile may mean reduced spending in retirement to ensure success.
Free Resources

Aggressive Risk Profile
90% equities/10% fixed income
Assertive Risk Profile
75% equities/25% fixed income
Balanced Risk Profile
60% equities/40% fixed income
Cautious Risk Profile
45% equities/55% fixed income
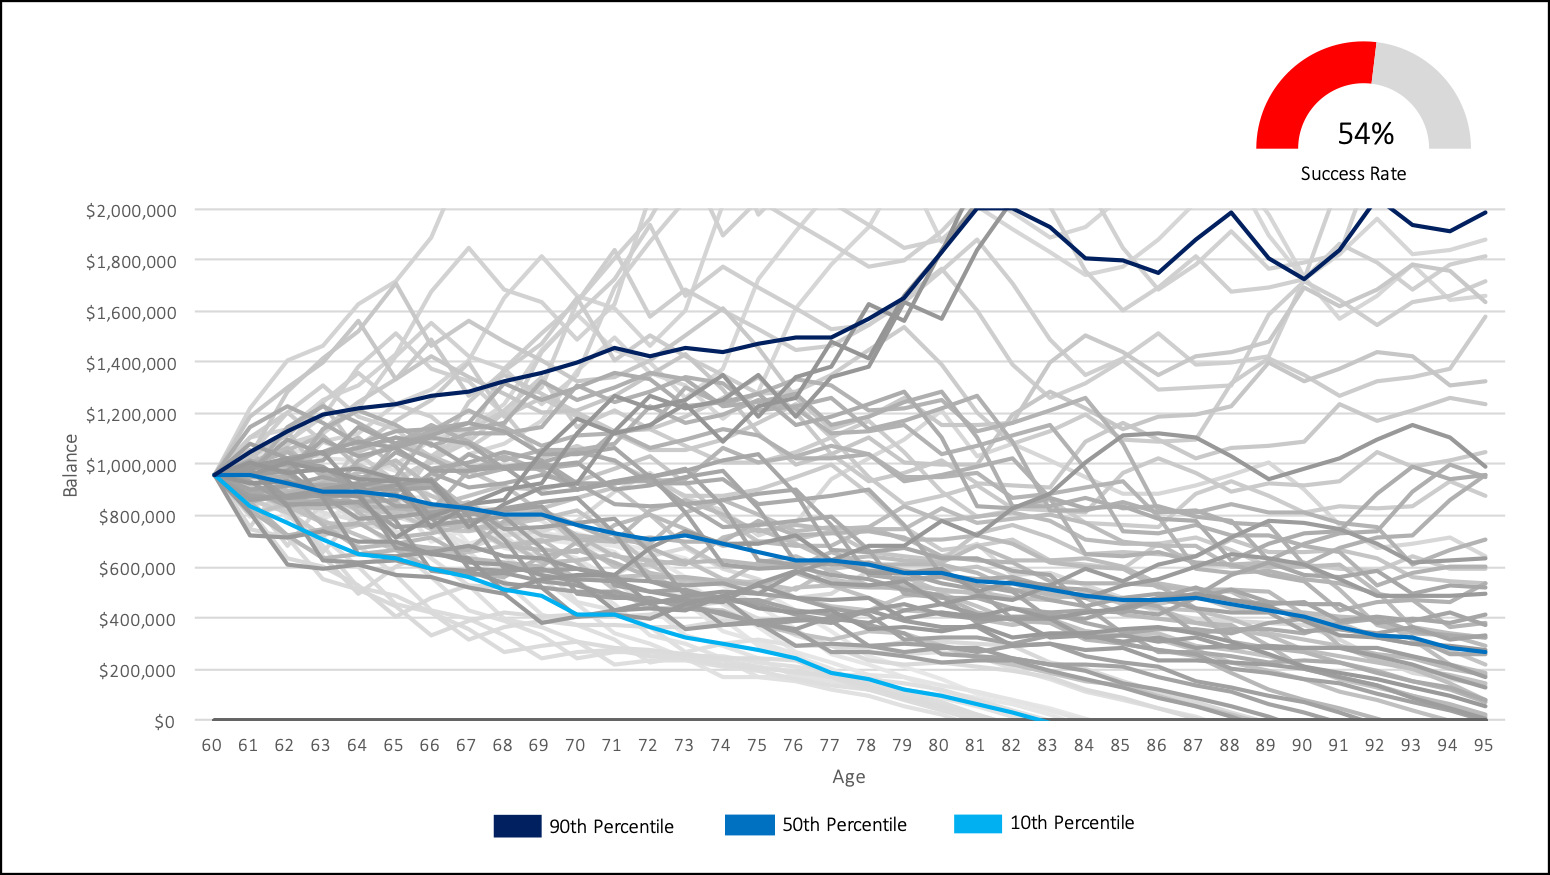
Conservative Risk Profile
30% equities/70% fixed income
Join over 250,000 people reading PlanEasy.ca each year. New blog posts weekly!
Tax planning, benefit optimization, budgeting, family planning, retirement planning and more...
Join over 250,000 people reading PlanEasy.ca each year. New blog posts weekly!
Tax planning, benefit optimization, budgeting, family planning, retirement planning and more...


0 Comments